This series of machine learning algorithms and Python practice is mainly based on the book "Machine Learning in Action " . Because I want to learn Python, and then I want to learn more about some machine learning algorithms, I want to implement several more commonly used machine learning algorithms through Python. I happened to meet this samely-oriented book, so I used the process of this book to learn.
In the previous blog post , we talked about the k-means algorithm. However, the k-means algorithm has a relatively large disadvantage that it is sensitive to the selection of the initial k centroid points. Some people have proposed a bisecting k-means algorithm, which appeared to solve this problem under certain circumstances. In other words, it is less sensitive to the choice of the initial k centroids. Then we come to understand and implement this algorithm.
Bisection k-means algorithm
The main idea of the bisection k-means algorithm is to first treat all points as a cluster, and then divide the cluster into two. Then select the cluster that can minimize the clustering cost function (that is, the sum of squared errors) into two clusters. This continues until the number of clusters is equal to the number k given by the user.
The above implied a principle: because the sum of the squared error of the cluster can measure the clustering performance, the smaller the value is, the closer the data points are to their centroids, the better the clustering effect is. So we need to divide the cluster with the largest sum of squared errors again, because the larger the sum of squared errors, the worse the clustering of the cluster, and the more likely multiple clusters are treated as one cluster, so we first need Divide this cluster.
The pseudo code of the binary k-means algorithm is as follows:
***************************************************************
Treat all data points as a cluster
When the number of clusters is less than k
For each cluster
Calculating total error
K-means clustering on a given cluster (k = 2)
Calculate the total error after halving the cluster
Select the cluster with the smallest error for partitioning
***************************************************************
Second, Python implementation
I use Python version 2.7.5. Additional libraries are Numpy and Matplotlib. For specific installation and configuration, see the previous blog post . There are more detailed comments in the code. I don't know if there are any mistakes. If so, I hope everyone will correct me (the results of each operation may be different). I wrote a function to visualize the results, but it can only be used on two-dimensional data. Paste the code directly:
biKmeans.py
#################################################
# kmeans: k-means cluster
# Author : zouxy
# Date : 2013-12-25
# HomePage : http://blog.csdn.net/zouxy09
# Email : zouxy09@qq.com
#################################################
from numpy import *
import time
import matplotlib.pyplot as plt
# calculate Euclidean distance
def euclDistance(vector1, vector2):
return sqrt(sum(power(vector2 - vector1, 2)))
# init centroids with random samples
def initCentroids(dataSet, k):
numSamples, dim = dataSet.shape
centroids = zeros((k, dim))
for i in range(k):
index = int(random.uniform(0, numSamples))
centroids[i, :] = dataSet[index, :]
return centroids
# k-means cluster
def kmeans(dataSet, k):
numSamples = dataSet.shape[0]
# first column stores which cluster this sample belongs to,
# second column stores the error between this sample and its centroid
clusterAssment = mat(zeros((numSamples, 2)))
clusterChanged = True
## step 1: init centroids
centroids = initCentroids(dataSet, k)
while clusterChanged:
clusterChanged = False
## for each sample
for i in xrange(numSamples):
minDist = 100000.0
minIndex = 0
## for each centroid
## step 2: find the centroid who is closest
for j in range(k):
distance = euclDistance(centroids[j, :], dataSet[i, :])
if distance < minDist:
minDist = distance
minIndex = j
## step 3: update its cluster
if clusterAssment[i, 0] != minIndex:
clusterChanged = True
clusterAssment[i, :] = minIndex, minDist**2
## step 4: update centroids
for j in range(k):
pointsInCluster = dataSet[nonzero(clusterAssment[:, 0].A == j)[0]]
centroids[j, :] = mean(pointsInCluster, axis = 0)
print 'Congratulations, cluster using k-means complete!'
return centroids, clusterAssment
# bisecting k-means cluster
def biKmeans(dataSet, k):
numSamples = dataSet.shape[0]
# first column stores which cluster this sample belongs to,
# second column stores the error between this sample and its centroid
clusterAssment = mat(zeros((numSamples, 2)))
# step 1: the init cluster is the whole data set
centroid = mean(dataSet, axis = 0).tolist()[0]
centList = [centroid]
for i in xrange(numSamples):
clusterAssment[i, 1] = euclDistance(mat(centroid), dataSet[i, :])**2
while len(centList) < k:
# min sum of square error
minSSE = 100000.0
numCurrCluster = len(centList)
# for each cluster
for i in range(numCurrCluster):
# step 2: get samples in cluster i
pointsInCurrCluster = dataSet[nonzero(clusterAssment[:, 0].A == i)[0], :]
# step 3: cluster it to 2 sub-clusters using k-means
centroids, splitClusterAssment = kmeans(pointsInCurrCluster, 2)
# step 4: calculate the sum of square error after split this cluster
splitSSE = sum(splitClusterAssment[:, 1])
notSplitSSE = sum(clusterAssment[nonzero(clusterAssment[:, 0].A != i)[0], 1])
currSplitSSE = splitSSE + notSplitSSE
# step 5: find the best split cluster which has the min sum of square error
if currSplitSSE < minSSE:
minSSE = currSplitSSE
bestCentroidToSplit = i
bestNewCentroids = centroids.copy()
bestClusterAssment = splitClusterAssment.copy()
# step 6: modify the cluster index for adding new cluster
bestClusterAssment[nonzero(bestClusterAssment[:, 0].A == 1)[0], 0] = numCurrCluster
bestClusterAssment[nonzero(bestClusterAssment[:, 0].A == 0)[0], 0] = bestCentroidToSplit
# step 7: update and append the centroids of the new 2 sub-cluster
centList[bestCentroidToSplit] = bestNewCentroids[0, :]
centList.append(bestNewCentroids[1, :])
# step 8: update the index and error of the samples whose cluster have been changed
clusterAssment[nonzero(clusterAssment[:, 0].A == bestCentroidToSplit), :] = bestClusterAssment
print 'Congratulations, cluster using bi-kmeans complete!'
return mat(centList), clusterAssment
# show your cluster only available with 2-D data
def showCluster(dataSet, k, centroids, clusterAssment):
numSamples, dim = dataSet.shape
if dim != 2:
print "Sorry! I can not draw because the dimension of your data is not 2!"
return 1
mark = ['or', 'ob', 'og', 'ok', '^r', '+r', 'sr', 'dr', '<r', 'pr']
if k > len(mark):
print "Sorry! Your k is too large! please contact Zouxy"
return 1
# draw all samples
for i in xrange(numSamples):
markIndex = int(clusterAssment[i, 0])
plt.plot(dataSet[i, 0], dataSet[i, 1], mark[markIndex])
mark = ['Dr', 'Db', 'Dg', 'Dk', '^b', '+b', 'sb', 'db', '<b', 'pb']
# draw the centroids
for i in range(k):
plt.plot(centroids[i, 0], centroids[i, 1], mark[i], markersize = 12)
plt.show()
Test results
The test data is two-dimensional, with a total of 80 samples. There are 4 classes. See the previous blog post for details .
Test code:
test_biKmeans.py
#################################################
# kmeans: k-means cluster
# Author : zouxy
# Date : 2013-12-25
# HomePage : http://blog.csdn.net/zouxy09
# Email : zouxy09@qq.com
#################################################
from numpy import *
import time
import matplotlib.pyplot as plt
## step 1: load data
print "step 1: load data..."
dataSet = []
fileIn = open('E:/Python/Machine Learning in Action/testSet.txt')
for line in fileIn.readlines():
lineArr = line.strip().split('\t')
dataSet.append([float(lineArr[0]), float(lineArr[1])])
## step 2: clustering...
print "step 2: clustering..."
dataSet = mat(dataSet)
k = 4
centroids, clusterAssment = biKmeans(dataSet, k)
## step 3: show the result
print "step 3: show the result..."
showCluster(dataSet, k, centroids, clusterAssment)
Here are the results of running twice:
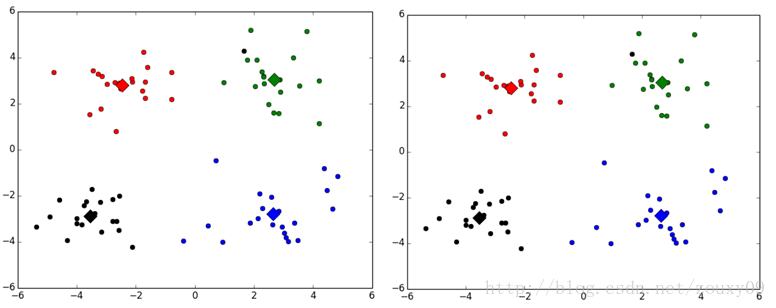
Different classes are represented by different colors, where the large diamond is the mean centroid point of the corresponding class.
In fact, this algorithm works differently when the initial centroid selection is different. I didn't read the initial paper, and I'm not sure if it will converge to the global minimum. The book "Machine Learning in Action" says it is okay , but because the results of each run are different, I am a bit skeptical, I did not find relevant instructions when I went to find the information myself. Thank you for your understanding of this algorithm.
0 comments:
Post a Comment