এই নথিতে হাইপারস্পেকট্রাল রিমোট সেন্সিং চিত্রগুলির ধারণা সংজ্ঞা, বিশ্লেষণ এবং শ্রেণিবিন্যাসের প্রাথমিক জ্ঞানের সংক্ষিপ্তসার রয়েছে। প্রথম অংশে হাইপারস্পেকট্রাল ইমেজের সাধারণ নীতি এবং জ্ঞান পরিচয় করিয়ে দেয়, দ্বিতীয় অংশ হাইপারস্পেকট্রাল ইমেজের শব্দ সমস্যার সাথে পরিচয় করিয়ে দেয়; তৃতীয় অংশে হাইপারস্পেকট্রাল ইমেজের ডেটা রিডানডেন্সি সমস্যা এবং অপ্রয়োজনীয়তা সমাধানের জন্য ডেটা মাত্রা হ্রাসের পদ্ধতি উপস্থাপন করে; চতুর্থ অংশটি উপস্থাপন করে হাইপারস্পেকট্রাল ইমেজগুলিতে মিশ্র পিক্সেলের সমস্যা বর্ণালী ডেমিক্সিংয়ের একটি নির্দিষ্ট ডিগ্রী প্রবর্তন করে।পঞ্চম এবং ষষ্ঠ বিভাগটি যথাক্রমে তত্ত্বাবধানে শ্রেণিবিন্যাস এবং হাইপারস্পেকট্রাল চিত্রগুলির উপ-তত্ত্বাবধানে শ্রেণিবিন্যাসের বৈশিষ্ট্য, প্রক্রিয়া এবং আলগোরিদিমগুলি প্রবর্তন করে।
1. প্রাথমিক ভূমিকা
হাইপারস্পেকট্রাল রিমোট সেন্সিং একটি বহুমাত্রিক তথ্য অর্জন প্রযুক্তি যা ইমেজিং প্রযুক্তি এবং বর্ণালী প্রযুক্তি সংযুক্ত করে এবং একই সাথে লক্ষ্য বর্ণের দ্বি-মাত্রিক সংগ্রহ স্থান এবং উচ্চ বর্ণালী রেজোলিউশন সহ অবিচ্ছিন্ন, সংকীর্ণ-ব্যান্ড চিত্র ডেটা প্রাপ্ত করতে এক-মাত্রিক বর্ণালী তথ্য সনাক্ত করে।
হাইপারস্পেকট্রাল এবং উচ্চ-রেজোলিউশন চিত্রগুলি , মাল্টিস্পেক্টেক্টাল চিত্রগুলি আলাদা।
হাইপারস্পেকট্রাল স্বীকৃতি সুবিধা:
বর্ণালী রেজোলিউশন উচ্চ এবং ব্যান্ডের সংখ্যা বেশি It এটি স্থল বৈশিষ্ট্যগুলির প্রায় ক্রমাগত বর্ণালী চরিত্রগত বক্ররেখা অর্জন করতে পারে এবং প্রয়োজন অনুসারে টার্গেট বৈশিষ্ট্যগুলি হাইলাইট করার জন্য নির্দিষ্ট ব্যান্ডগুলি নির্বাচন বা নিষ্কাশন করতে পারে;
একই স্থানিক রেজোলিউশনে বর্ণালি কভারেজটি আরও বিস্তৃত এবং বৈদ্যুতিক চৌম্বকীয় তরঙ্গগুলিতে স্থলজগতের প্রতিক্রিয়ার বৈশিষ্ট্যগুলি সনাক্ত করা যায়;
একাধিক ব্যান্ড, যা ব্যান্ডগুলির মধ্যে পারস্পরিক সংশোধনকে সহজতর করে;
পরিমাণগত ক্রমাগত বর্ণালী কার্ভ ডেটা স্থল পৃষ্ঠের বর্ণালী ব্যবস্থার মডেল দ্বারা চিত্রের শ্রেণিবিন্যাসের প্রবর্তনের শর্ত সরবরাহ করে;
প্রচুর পরিমাণে রেডিয়েশন, স্পেস এবং বর্ণালী তথ্য ধারণ করে, এটি বিভিন্ন তথ্যের একটি বিস্তৃত ক্যারিয়ার।
হাইপারস্পেকট্রাল সনাক্তকরণে সমস্যাগুলি:
বিশাল পরিমাণে ডেটা, ছবিতে কয়েক ডজন থেকে কয়েকশত ব্যান্ড থাকে, একক-ব্যান্ড রিমোট সেন্সিং চিত্রের চেয়ে ডেটা পরিমাণ কয়েকগুণ বেশি; তথ্যগুলিতে প্রচুর অপ্রয়োজনীয়তা রয়েছে, এবং অনুচিত প্রক্রিয়াকরণ শ্রেণিবিন্যাসের নির্ভুলতার উপর প্রভাব ফেলবে;
হাইপারস্পেকট্রাল চিত্রগুলির শ্রেণিবিন্যাসের জন্য একদিকে বর্ণালী ক্যালিব্রেশন এবং প্রতিবিম্ব রূপান্তরকরণের উচ্চতর নির্ভুলতার প্রয়োজন হয় এবং জটিল ইমেজিং পদ্ধতি এবং বায়ুমণ্ডলীয় সংশোধন, জ্যামিতিক সংশোধন সহ বিশাল ডেটা ভলিউমের কারণে চিত্রের ডেটা প্রিপ্রোসেস করা কঠিন is বর্ণালী ক্রমাঙ্কন এবং প্রতিবিম্ব রূপান্তর;
ব্যান্ডগুলির মধ্যে অনেকগুলি ব্যান্ড এবং উচ্চ পারস্পরিক সম্পর্ক রয়েছে, সুতরাং শ্রেণিবিন্যাসের জন্য প্রয়োজনীয় প্রশিক্ষণের নমুনাগুলির সংখ্যা অনেক বেড়েছে, এবং প্রাপ্ত প্রশিক্ষণের পরামিতিগুলি অপর্যাপ্ত প্রশিক্ষণের নমুনাগুলির কারণে প্রায়শই অবিশ্বাস্য হয় (মাত্রিক বিপর্যয়);
প্রচলিত রিমোট সেন্সিং প্রসেসিং মডেল এবং পদ্ধতিগুলি হাইপারস্পেকট্রাল চিত্রের শ্রেণিবিন্যাসের চাহিদা পূরণ করতে পারে না। প্রধান সমস্যাগুলির মধ্যে একটি হল পরিসংখ্যানগত শ্রেণিবদ্ধকরণ মডেলের প্যারামিটার অনুমানের সমস্যা, যার জন্য বর্ণালী বৈশিষ্ট্যগুলির উচ্চ নির্বাচন প্রয়োজন।
হাইপারস্পেকট্রাল চিত্রের শ্রেণিবিন্যাসে হিউজ ঘটনা:
হিউজেস প্রপঞ্চ: মেশিন লার্নিং সমস্যা সীমিত তথ্য নমুনা, এটি উচ্চ মাত্রিক বৈশিষ্ট্য স্থান প্রয়োজন একটি "প্রকৃতির রাষ্ট্র" শেখার (প্রতিটি বৈশিষ্ট্য সম্ভাব্য মান একটি সীমার নিতে পারেন) (সম্ভবত অসীম বন্টন), যথেষ্ট প্রয়োজন প্রশিক্ষণের ডেটা পরিমাণে কিছু নমুনা সংমিশ্রণ রয়েছে। একটি নির্দিষ্ট সংখ্যক প্রশিক্ষণের নমুনা দেওয়া, এর ভবিষ্যদ্বাণীমূলক শক্তি ক্রমবর্ধমান মাত্রার সাথে হ্রাস পাচ্ছে।
হাইপারস্পেকট্রাল রিমোট সেন্সিং ইমেজগুলিতে, যখন প্রশিক্ষণের নমুনাগুলির সংখ্যা সীমাবদ্ধ থাকে, তখন চিত্র ব্যান্ডের সংখ্যার সাথে শ্রেণিবিন্যাসের নির্ভুলতা বৃদ্ধি পায় একটি নির্দিষ্ট চূড়ান্ত মান পৌঁছানোর পরে, শ্রেণিবিন্যাসের সঠিকতা ব্যান্ডের সংখ্যার সাথে হ্রাস পায়।
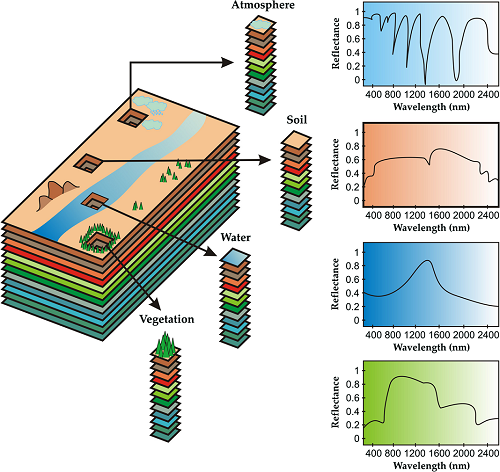
Remoteতিহ্যবাহী দূরবর্তী সেন্সিং চিত্র বিশ্লেষণটি চিত্রের স্থানিক তথ্য ব্যবহার করে এবং হাইপারস্পেকট্রাল চিত্র বিশ্লেষণের মূল বর্ণালী বিশ্লেষণ । হাইপারস্পেকট্রাল রিমোট সেন্সিং ডেটা বর্ণালী ইমেজ কিউব।এর প্রধান বৈশিষ্ট্যটি চিত্র স্থানের মাত্রা এবং বর্ণালী মাত্রা সম্পর্কিত তথ্যগুলির একীকরণ .একটি ব্যান্ডের সাথে তুলনায়, এতে আরও এক-মাত্রিক বর্ণালী তথ্য রয়েছে। পৃষ্ঠতল স্থান চিত্রটি অর্জন করার সময়, প্রতিটি পিক্সেলের সাথে সম্পর্কিত প্রতিটি বস্তুর বর্ণালী তথ্য পাওয়া যাবে।
উপরের চিত্রটি একটি নির্দিষ্ট ব্যান্ডের রিমোট সেন্সিং চিত্র এবং একটি পিক্সেলের বর্ণালী বৈশিষ্ট্য।
২. হাইপারস্পেকট্রাল ডেটা শোনার প্রক্রিয়াজাতকরণ
হাইপারস্পেকট্রাল চিত্রগুলির সূক্ষ্ম বর্ণালী তথ্য গ্রাউন্ড বৈশিষ্ট্য বর্ণালীটির সূক্ষ্ম বৈশিষ্ট্যগুলিকে পুরোপুরি প্রতিফলিত করতে পারে। বিভিন্ন বৈশিষ্ট্যের বর্ণালী বৈশিষ্ট্যের তুলনামূলক পার্থক্য অনুযায়ী বৈশিষ্ট্যটির শ্রেণিবিন্যাস উপলব্ধি করা যায়, এবং লক্ষ্য সনাক্তকরণ এবং সূক্ষ্ম শ্রেণিবিন্যাস উপলব্ধি করা যায়।
তবে, ইমেজিং স্পেকট্রোমিটারের ঘন চ্যানেলের কারণে হালকা ইমেজিং শক্তির অভাবের কারণে , প্যানক্রোমেটিক চিত্রের তুলনায় হাইপারস্পেকট্রাল ইমেজের সিগন্যাল-টু-শোর রেশিও (এসএনআর) উন্নত করা কঠিন। চিত্রের ডেটা অর্জনের প্রক্রিয়াতে, গোলমালের প্রভাবের অধীনে স্থল বৈশিষ্ট্যগুলির বৈশিষ্ট্যগুলি "বিকৃতি" প্রবণ হয়। তদ্ব্যতীত, হাইপারস্পেকট্রাল ডেটা প্রচুর পরিমাণের কারণে, সূক্ষ্ম শ্রেণিবদ্ধকরণ প্রক্রিয়াতে, প্রায়শই মাত্রিক মাত্রা হ্রাস প্রক্রিয়াকরণ করা প্রয়োজন, এবং মাত্রিকতা হ্রাস প্রক্রিয়ায়, সংকেত এবং সংকোচনের শব্দটি সর্বোচ্চ মাত্রায় ধরে রাখা প্রয়োজন, সুতরাং সঠিক শব্দ মূল্যায়ন করা প্রয়োজন। এছাড়াও, সূক্ষ্ম শ্রেণিবিন্যাসের ফলাফলগুলিতে গোলমালের সবচেয়ে বেশি প্রভাব পড়ে noise অতএব, হাইপারস্পেকট্রাল ডেটার জন্য শব্দ মূল্যায়ন প্রয়োজন।
প্রধান শব্দটি গাউসিয়ান শ্বেত শব্দ হিসাবে বিবেচিত হয়, যা সংযোজনীয় শব্দ এবং গুণগত শব্দে বিভক্ত।
শব্দ মূল্যায়নের জন্য প্রধানত তিনটি পদ্ধতি রয়েছে: পরীক্ষাগার পদ্ধতি, গা dark় বর্তমান পদ্ধতি এবং চিত্র পদ্ধতি। যেহেতু প্রথম দুটি পদ্ধতি পরীক্ষা-নিরীক্ষায় প্রয়োগ করা কঠিন, তৃতীয়টি, চিত্র পদ্ধতিটি ব্যাপকভাবে ব্যবহৃত হয় ।
চিত্র পদ্ধতিটি নিম্নলিখিত ধরণের মধ্যে বিভক্ত:
অভিন্ন অঞ্চল পদ্ধতি (এইচএ)
মূল ধারণাটি হ'ল চিত্র থেকে চারটি অধিক ইউনিফর্ম অঞ্চল নির্বাচন করা এবং এই অভিন্ন অঞ্চলের স্ট্যান্ডার্ড বিচ্যুতির গড় গণনা করে চিত্রের শব্দের আনুমানিক মান অর্জন।
অসুবিধাগুলি: অভিন্ন অঞ্চল নির্বাচন ম্যানুয়ালি সম্পাদন করা প্রয়োজন এবং স্বয়ংক্রিয় করা যায় না; শর্ত পূরণ করে সমান অঞ্চলগুলি বেশিরভাগ দূরবর্তী সেন্সিং মানচিত্রে উপস্থিত থাকে না; উপকেন্দ্রগুলির শব্দের অনুমান সমগ্র চিত্রের শব্দকে উপস্থাপন করতে পারে না।
ভূতাত্ত্বিক পদ্ধতি (জিএস)
মূল ধারণা: চিত্র থেকে বেশ কয়েকটি অভিন্ন সরু ব্যান্ড নির্বাচন করুন এবং এই সরু ব্যান্ডগুলির আধা-বৈকল্পিক কার্যকারিতা গণনা করে চিত্রের গোলমালের অনুমানটি উপলব্ধি করুন। একটি নির্দিষ্ট পরিমাণে, ইমেজিং বর্ণালী ডেটার স্থানিক পারস্পরিক সম্পর্ক ব্যবহৃত হয়।
অসুবিধা: অভিন্ন অঞ্চল পদ্ধতির অনুরূপ।
স্থানীয় গড় এবং স্থানীয় স্ট্যান্ডার্ড বিচ্যুতি (এলএমএলএসডি)
মূল ধারণা: ধরে নিন যে চিত্রটি প্রচুর পরিমাণে ইউনিফর্ম ছোট ছোট ব্লকের সমন্বয়ে গঠিত এবং শব্দটি মূলত সংযোজনীয় শোরগোল। স্থানীয় গড় এবং স্থানীয় স্ট্যান্ডার্ড বিচ্যুতির ধারণাগুলি ব্যবহার করে চিত্রটি অনেকগুলি ছোট ব্লকে বিভক্ত হয় এবং তারপরে এই সাব-ব্লকের মানক বিচ্যুতি স্থানীয় গোলমালের আকার হিসাবে গণনা করা হয়, এবং বৃহত্তম সংখ্যক সাব-ব্লকের অন্তর অন্তর্ভুক্ত স্থানীয় স্ট্যান্ডার্ড বিচ্যুতির গড় মান পুরো চিত্র হিসাবে নির্বাচিত হয়। সেরা শব্দ অনুমান।
অসুবিধাগুলি: শুধুমাত্র সাদা গাউসিয়ান শব্দের জন্য বৈধ rand র্যান্ডম গাউসিয়ান শব্দের সাথে চিত্রগুলির জন্য, সংকেত শব্দ দ্বারা বিঘ্নিত হয়।
স্থানিক / বর্ণালী মাত্রা সজ্জা (এসএসডিসি)
মূল ধারণা: এটি হাইপারস্পেকট্রাল চিত্রগুলির জন্য বিশেষত একটি শব্দ মূল্যায়ন পদ্ধতি It এটি হাইপারস্পেকট্রাল ইমেজের স্থানিক এবং বর্ণালী মাত্রার মধ্যে উচ্চ সম্পর্কের বৈশিষ্ট্যগুলি ব্যবহার করে .এটি উচ্চ সম্পর্কের সাথে সংকেতগুলি সরাতে মাল্টিভারিয়েট লিনিয়ার রিগ্রেশন ব্যবহার করে। গোলমাল অনুমান করা হয়।
মূল্যায়ন: এই পদ্ধতিটি গ্রাউন্ড কভারের ধরণের দ্বারা কম প্রভাবিত হয় এবং স্বয়ংক্রিয়ভাবে কার্যকর করা যায় hyp এটি হাইপারস্পেকট্রাল ইমেজ শব্দের মূল্যায়নের জন্য তুলনামূলকভাবে স্থিতিশীল পদ্ধতি।
৩. হাইপারস্পেকট্রাল চিত্রের ডেটার মাত্রা হ্রাস করার সাধারণ পদ্ধতি
হাইপারস্পেকট্রাল রিমোট সেন্সিং ইমেজগুলিতে বিপুল সংখ্যক বর্ণালী ব্যান্ড বৈশিষ্ট্য নিষ্কাশনের জন্য অত্যন্ত সমৃদ্ধ তথ্য সরবরাহ করে, যা সূক্ষ্ম বৈশিষ্ট্য শ্রেণিবিন্যাসের পক্ষে উপযুক্ত However তবে, ব্যান্ডগুলি বৃদ্ধি তথ্যের অপ্রয়োজনীয়তা এবং বর্ধিত ডেটা প্রক্রিয়াকরণ জটিলতায় ডেকে আনবে। ।
ডেটা মাত্রিকতা হ্রাস নিম্নলিখিত শর্তগুলি পূরণ করে: যতটা সম্ভব ডেটার বৈশিষ্ট্যযুক্ত তথ্য বজায় রাখুন; ডেটা অপ্রয়োজনীয়তা এবং পারস্পরিক সম্পর্ক অপসারণ করুন।
মাত্রা হ্রাস প্রধানত বৈশিষ্ট্য নির্বাচন এবং বৈশিষ্ট্য নিষ্কাশন দুটি দিক থেকে সঞ্চালিত হয় ।
3.1 বৈশিষ্ট্য নির্বাচন
বৈশিষ্ট্য নির্বাচন বর্ণালী সংমিশ্রণ, যে, মূল বর্ণালী থেকে ব্যান্ড সংখ্যা N হয়এনব্যান্ডে এম নির্বাচন করুনএমব্যান্ড (এন> এম)(এন>এম), সম্ভাব্য বর্ণাল সংমিশ্রনের সংখ্যা
এন!এম! ( এন- এম) !
এন!এম!(এন-এম)!
বর্ণালী ব্যান্ড নির্বাচন কমাতে আপনি এখানে ব্যান্ড সূচক পদ্ধতিটি ব্যবহার করতে পারেন ।
* ব্যান্ড সূচক পদ্ধতি: * Hyperspectral রিমোট সেন্সিং ইমেজ পারস্পরিক সম্পর্ক অনুযায়ী বিভক্ত কেকেগোষ্ঠীগুলি (যেমন শর্টওয়েভ আলো, দৃশ্যমান আলো, কাছাকাছি-ইনফ্রারেড), প্রতিটি গ্রুপে ব্যান্ডের সংখ্যা এন হোকঠ( l = 1 , 2 , ⋯ , কে )এনঠ(ঠ=1,2,⋯,ট)। সঙ্গে পিআমি জেপিআমিঞউপস্থাপন ব্যান্ড iআমিব্যান্ড জেঞসম্পর্কযুক্ত সহগ, σআমিσআমিউপস্থাপন ব্যান্ড iআমিভেরিয়েন্স, আরএকটিআরএকটিউপস্থাপন ব্যান্ড iআমিবিভিন্ন গ্রুপের অন্যান্য ব্যান্ডের পারস্পরিক সম্পর্কের সহগের পরম মানের যোগফল, আরWআরWউপস্থাপন ব্যান্ড iআমিতারপরে একই গ্রুপের অন্যান্য ব্যান্ডের সাথে পারস্পরিক সম্পর্কের সহগের পরম মানের গড়
আরW= 1এনঠ∑ | পিআমি জে|
আরW=1এনঠΣ|পিআমিঞ|
এবং এইভাবে ব্যান্ড iআমিব্যান্ড সূচকটি হিসাবে প্রকাশ করা যেতে পারে:
পিআমি= σআমিআরএকটি+ আরW
পিআমি=σআমিআরএকটি+ +আরW
পর্যবেক্ষণের মাধ্যমে, আমরা জানি যে বৈকল্পিকতা বৃদ্ধি পাওয়ার সাথে সাথে, ব্যান্ডের আরও বেশি তথ্য থাকে; যেহেতু পারস্পরিক সম্পর্ক সহগ হ্রাস হয়, ব্যান্ডের স্বাধীনতা বেশি হয়।
ব্যান্ড সূচক একটি গুরুত্বপূর্ণ প্যারামিটার যা ব্যান্ডের বৈশিষ্ট্য সম্পর্কিত তথ্য এবং পারস্পরিক সম্পর্কের সামগ্রিক অন্তর্ভুক্তিকে প্রতিফলিত করে।
ব্যান্ড সূচক এবং লক্ষ্য বস্তুর বস্তুর কার্যকর বর্ণালী পরিসীমা একত্রিত করে আমরা ব্যান্ডটি নির্বাচন করতে পারি এবং তারপরে পরবর্তী পদক্ষেপে এটি সনাক্ত এবং শ্রেণিবদ্ধ করতে পারি।
3.2 বৈশিষ্ট্য নিষ্কাশন
হাইপারস্পেকট্রাল ডেটা মাত্রিকতা হ্রাস প্রযুক্তিটি চিত্রের বৈশিষ্ট্য নিষ্কাশনকে লক্ষ্য করে। এটি উচ্চ মাত্রিক তথ্যের বৈশিষ্ট্যগুলি কার্যকরভাবে প্রকাশ করতে নিম্ন-মাত্রিক ডেটা ব্যবহার করে, তথ্যের পরিমাণ আরও সংকুচিত করে, যা তথ্যের দ্রুত নিষ্কাশনের জন্য আরও উপযুক্ত। Dimensionality কমানো খুব ব্যাপক বিষয়বস্তু, hyperspectral চিত্রাবলী প্রধানত গঠিত ভুতুড়ে মাত্রা কমাতে এবং ভুতুড়ে বৈশিষ্ট্য মাত্রা নিষ্কর্ষ ভিত্তি করে।
পূর্ববর্তী বিভাগে বৈশিষ্ট্য নির্বাচনটি মূল স্থানটির উপসীমা তৈরি করতে মূল বৈশিষ্ট্য স্থানটিতে বৈশিষ্ট্য নির্বাচন পদ্ধতি সম্পর্কে কথা বলেছিল Next পরবর্তী, রৈখিক রূপান্তর পদ্ধতিটি চালু করা হয়েছে :ওয়াই= বি এক্সওয়াই=বিএক্স উচ্চ-মাত্রিক ডেটা স্পেস থেকে, একটি উপযুক্ত নিম্ন-মাত্রিক উপ-স্পেস (কোনও সাধারণ বৈশিষ্ট্য নির্বাচনের সংমিশ্রণ নয়) তৈরি করা হয়, যাতে এই স্পেসের ডেটা বিতরণটি একটি অনুকূল অর্থে মূল ডেটা বর্ণনা করতে পারে।
৩.২.১ মূল উপাদান বিশ্লেষণ
অধ্যক্ষ উপাদান বিশ্লেষণ (পিসিএ) হাইপারস্পেকট্রাল ডেটার জন্য সর্বাধিক প্রাথমিক মাত্রা হ্রাস পদ্ধতি, এবং এটি হাইপারস্পেকট্রাল ডেটা সংক্ষেপণ, ডেকোরেশন, শব্দ কমানো এবং বৈশিষ্ট্য নিষ্কাশনে একটি বিশাল ভূমিকা পালন করে। পিসিএ ট্রান্সফর্মটি হোটেলিং ট্রান্সফর্ম এবং কেএল (কর্চুনেন-লভ) রূপান্তর হিসাবেও পরিচিত । রূপান্তরিত মূল উপাদান উপাদানগুলি একে অপরের সাথে সম্পর্কিত নয় এবং মূল উপাদানগুলির সংখ্যা বাড়ার সাথে উপাদানটিতে থাকা তথ্যের পরিমাণ হ্রাস পায়।
হাইপারস্পেকট্রাল রিমোট সেন্সিং ডেটার পিসিএ রূপান্তরে প্রতিটি ব্যান্ডকে সাধারণত ভেক্টর হিসাবে ধরা হয়।এটি ধারণা করা হয় যে হাইপারস্পেক্ট্রাল রিমোট সেন্সিং ডেটা পিপিব্যান্ডগুলি, চিত্রের স্থানের আকারটি m×nমি×এন, নির্দিষ্ট প্রক্রিয়াকরণ প্রবাহ:
চিত্র ভেক্টরাইজেশন: ইনপুট চিত্রের ডেটা এক্স=(এক্স) হিসাবে প্রকাশ করা যেতে পারে1, এক্স2, ⋯ , এক্সপি)টিএক্স=(এক্স1,এক্স2,⋯,এক্সপি)টিযেখানে এক্সআমিএক্সআমিএন হিসাবে প্রকাশিত। 1এন×1কলামের ভেক্টর, এখানে এন= এম × n-এন=মি×এন। এটি হ'ল, চিত্রগুলি সারি বা কলাম দ্বারা প্রসারিত হয় এবং নিয়মিত সংযুক্ত থাকে, যাকে ভেক্টর বলা হয়।
ভেক্টর সেন্ট্রালাইজেশন: ভেক্টর গ্রুপের সমস্ত ভেক্টরকে ভেক্টরের গড়ের ভেক্টর থেকে বিয়োগ করুন, অর্থাৎ, ওয়াই=এক্স-ই(এক্স)ওয়াই=এক্স-ই(এক্স)।
গণনা ভেক্টর গ্রুপ ওয়াইওয়াইকোভারিয়েন্স ম্যাট্রিক্স ΣΣ।
কোভেরিয়েন্স ম্যাট্রিক্স Find সন্ধান করুন ΣΣইগেনভ্যালু ম্যাট্রিক্স ΛΛএবং ইগেনভেક્ટર ম্যাট্রিক্স এএকজন।
প্রধান উপাদান রূপান্তর, জেড=এটিওয়াইজেড=একজনটিওয়াই।
পিসিএ রূপান্তর তথ্যের পরিমাণের উপর ভিত্তি করে একটি অরথোগোনাল লিনিয়ার ট্রান্সফর্মেশন হয় The রূপান্তরিত চিত্রের তথ্যটি প্রাথমিকভাবে প্রথম কয়েকটি প্রধান উপাদান উপাদানগুলিতে কেন্দ্রীভূত হয় small ছোট তথ্যের পরিমাণযুক্ত উপাদান উপাদানগুলি ট্রান্সফর্ম ডোমেনে ফেলে দেওয়া হয়। একটি আনুমানিক চিত্র।
পিসিএ রূপান্তরের উপর ভিত্তি করে, একটি ব্লক-ভিত্তিক প্রধান উপাদান উপাদান বিশ্লেষণ পদ্ধতি , একটি নির্দেশিত প্রধান উপাদান উপাদান বিশ্লেষণ পদ্ধতি (ডিপিসিএ) এবং একটি নির্বাচনী প্রধান উপাদান উপাদান পদ্ধতি (নির্বাচনী পিসিএ) প্রস্তাবিত হয়। ।
যাইহোক, পিসিএ রূপান্তরে দুটি সুস্পষ্ট ত্রুটি রয়েছে: একটি হ'ল চিত্রের সংখ্যাসূচক রূপান্তরটির একটি উল্লেখযোগ্য প্রভাব রয়েছে; অন্যটি হ'ল রূপান্তরকরণের পরে সংকেত-থেকে-শব্দের অনুপাত মূল উপাদানগুলির সংখ্যা বৃদ্ধির সাথে অগত্যা হ্রাস পায় না। এই দুটি সমস্যার প্রতিক্রিয়া হিসাবে, স্ট্যান্ডার্ডাইজড পিসিএ (এসপিসিএ) এবং রেসিডুয়াল-স্কেলড পিসিএ (আরপিসিএ) তৈরি করা হয়েছে ।
৩.২.২ সর্বোচ্চ গোলমাল ভগ্নাংশ রূপান্তর
যখন শব্দটির ভেরিয়েন্স বা গোলমাল অসমভাবে চিত্রের প্রতিটি ব্যান্ডে বিতরণ করা হয়, তখন সর্বাধিক বৈকল্পিকতার ভিত্তিতে পিসিএ পদ্ধতি গ্যারান্টি দেয় না যে মূল উপাদানটি বাড়ার সাথে সাথে চিত্রের গুণমান হ্রাস পাবে। অতএব, সর্বাধিক শব্দ ভগ্নাংশ (এমএনএফ) রূপান্তরটি এখানে চালু করা হয়েছে এবং এই রূপান্তরটি চিত্রের মান অনুযায়ী উপাদানগুলি সাজায়। এমএনএফ পদ্ধতিতে চিত্রের মানের পরামিতিগুলি বর্ণনা করতে মূলত এসএনআর এবং শব্দের অনুপাত ব্যবহার করা হয়।
ধরুন এক্স=[এক্স1, এক্স2, ⋯ , এক্সপি]টিএক্স=[এক্স1,এক্স2,⋯,এক্সপি]টিহয় p×Nপি×এন ম্যাট্রিক্স, সারি ভেক্টর গ্রুপের গড় ভেক্টর ই( এক্স) = 0ই(এক্স)=0, কোভেরিয়েন্স ম্যাট্রিক্স ডি(এক্স) = Σডি(এক্স)=Σ , ধরে নিচ্ছি
এক্স = এস + এন
এক্স=এস+ +এন
যেখানে এসএসএবং এনএনচিত্রটিতে যথাক্রমে সিগন্যাল এবং গোলমাল, এবং তারা সম্পর্কিত নয়।
যাক ΣএসΣএসএবং ΣএনΣএনযথাক্রমে Sএসএবং এনএনকোভেরিয়েন্স ম্যাট্রিক্স। এখানে ধারণা করা হয় যে গোলমালটি সংযোজনীয়, এবং শব্দের অনুপাত হিসাবে প্রকাশ করা যেতে পারে:
ভী একজন আর করুন & lt { এন } / ভী একজন আর করুন & lt { এক্স }
ভীএকটিR{এন}/ভীএকটিR{এক্স}
এমএনএফ রূপান্তরটি একটি লিনিয়ার রূপান্তর is
জেডআমি= কটিআমিএক্স , i = 1 , ⋯ , পি
জেডআমি=একটিআমিটিএক্স,আমি=1,⋯,পি
জেডআমিজেডআমিশব্দের অনুপাতটি একেবারে জেডের কাছে অর্থেগোনালঞ( j = 1 , ⋯ , i - 1 )জেডঞ(ঞ=1,⋯,আমি-1)উপাদানগুলির বৃহত্তম হবে একটিআমিএকটিআমিপ্রমিতকরণ,
একটিটিআমিΣ কআমি= 1
একটিআমিটিΣএকটিআমি=1
এটি থেকে এমএনএফ রূপান্তরটি প্রকাশিত হয়:
জেড = এটিএক্স
জেড=একজনটিএক্স
সূত্রে লিনিয়ার ট্রান্সফর্মেশন সহগ ম্যাট্রিক্স এ=[এ1, ক2, ⋯ , কপি]একজন=[একটি1,একটি2,⋯,একটিপি]ম্যাট্রিক্স Σ- 1ΣএনΣ-1Σএনআইগেনভেક્ટર ম্যাট্রিক্স, তারপরে
Σ- 1Σএনএ = Λ এ
Σ-1Σএনএকজন=Λএকজন
যেখানে তির্যক ম্যাট্রিক্স ΛΛইগেনুয়ালু ম্যাট্রিক্স, iআমিইগেনভ্যালু λআমিλআমি, সংশ্লিষ্ট উপাদানটির শব্দ অনুপাত
ভি ক আর { কটিআমিএন }ভি ক আর { কটিআমিজেড }= কটিআমিΣএনএকটিআমিএকটিটিআমিΣ কআমি
ভীএকটিR{একটিআমিটিএন}ভীএকটিR{একটিআমিটিজেড}=একটিআমিটিΣএনএকটিআমিএকটিআমিটিΣএকটিআমি
এমএনএফ ট্রান্সফর্মের চূড়ান্ত রূপান্তর ফলাফলের উপাদানগুলি সংকেত-থেকে-শব্দ অনুপাতের প্রস্থতা অনুসারে বাছাই করা হয়।
৩.২.৩ অন্যান্য সাধারণ রূপান্তর
অন্যান্য সাধারণ গঠিত রুপান্তর একটি সর্বনিম্ন / সর্বোচ্চ autocorrelation ফ্যাক্টর বিশ্লেষণ (নূন্যতম / সর্বোচ্চ autocorrelation ফ্যাক্টর, MAF) , গোলমাল স্থায়ী প্রধান উপাদান বিশ্লেষণ (NPCA) , ক্যানোনিকাল পারস্পরিক সম্পর্ক বিশ্লেষণ (CCA) , স্বাধীন উপাদান বিশ্লেষণ (স্বাধীন compnent বিশ্লেষণ, Ica) , অভিক্ষেপ সাধনা (অভিক্ষেপ সাধনা, পিপি) , NMF এবং অরৈখিক প্রধান উপাদান বিশ্লেষণ (কার্নেল পিসিএ, KPCA) কথা বলা ইত্যাদি।
এই পদ্ধতির প্রত্যেকটির নিজস্ব সীমাবদ্ধতা এবং প্রয়োগের সুযোগ রয়েছে এবং তথ্যের মান এবং বিভিন্ন অ্যাপ্লিকেশন চাহিদা অনুযায়ী উপযুক্ত পদ্ধতি নির্বাচন করা প্রয়োজন।
সাধারণভাবে ব্যবহৃত সিপিসিএ, এসপিসিএ, এমএএফ, এবং এমএনএফের সুবিধাগুলি এবং অসুবিধাগুলির সংক্ষিপ্তসার করে এবং লক্ষ্য সনাক্তকরণের জন্য হাইপারস্পেকট্রাল ডেটার মাত্রিকতা হ্রাসের পদ্ধতিগুলির তুলনা করে, নিম্নলিখিত কার্যকারিতা বিশ্লেষণ পাওয়া যায়:
এটি টেবিলের দ্বারা সংক্ষেপে এইভাবে করা যেতে পারে:
সিপিসিএর সুবিধাটি হ'ল যে তথ্য ক্ষতির পরিমাণটি ছোট, এবং রূপান্তরের পরে ডেটা কাঠামো ছোট, তবে এই পদ্ধতিটি সংখ্যাগত মান এবং আওয়াজ দ্বারা ব্যাপকভাবে প্রভাবিত হয়;
এসপিসিএর সুবিধাটি হ'ল এটি সংখ্যাসূচক মানের দ্বারা কম প্রভাবিত হয় এবং এটি তথ্য সংরক্ষণ এবং ডেটা স্ট্রাকচার ধরে রাখা উভয় ক্ষেত্রেই ভাল তবে এই শব্দটি উচ্চ শব্দে আক্রান্ত হয়;
এমএনএফ সংখ্যাসূচক মান এবং গোলমাল দ্বারা কম প্রভাবিত হয়, যখন তথ্য ক্ষতির পরিমাণ কম, তবে রূপান্তরের পরে তথ্য কাঠামো ব্যাপকভাবে প্রভাবিত হয়;
এমএএফের নিকৃষ্টতম পারফরম্যান্স রয়েছে এবং লক্ষ্য সনাক্তকরণে হাইপারস্পেকট্রাল ডেটার মাত্রিকতা হ্রাসের জন্য উপযুক্ত নয়
৪. হাইপারস্পেকট্রাল চিত্র মিশ্র পিক্সেল
সারফেস প্রতিফলন বা নির্গমন বর্ণালীতে দূরবর্তী সেন্সর সংকেত অর্জিত হয় ছবি উপাদানের (পিক্সেল) রেকর্ডের ইউনিট। হাইপারস্পেকট্রাল ইমেজিং স্পেকট্রোমিটার প্রচুর পরিমাণে ব্যান্ডগুলি অর্জন করে, এটি প্রতিটি ব্যান্ডের রেডিয়েশন সিগন্যালকে দুর্বল করে তুলবে the সংকেত-থেকে-শব্দ অনুপাতের উন্নতি করতে এবং চিত্রের গুণমান নিশ্চিত করার জন্য, তাত্ক্ষণিকভাবে দেখার ক্ষেত্রের একটি নির্দিষ্ট কোণ (আইএফওভি) নিশ্চিত করা প্রয়োজন । হাইপারস্পেকট্রাল ইমেজগুলির স্থানিক রেজোলিউশনটি প্যানক্রোমেটিক এবং মাল্টিসেপেক্ট্রাল চিত্রগুলির চেয়ে কম, মিশ্র পিক্সেলের সমস্যাটিকে বিশেষভাবে বিশিষ্ট করে তোলে।
সুতরাং হাইপারস্পেকট্রাল চিত্রগুলি বিশ্লেষণের জন্য traditionalতিহ্যবাহী চিত্রের স্থানিক তথ্য ব্যবহার করতে পারে না , পরিবর্তে তারা বর্ণালী মাত্রা থেকে চিত্রের তথ্য খনিতে শত শত ব্যান্ড সমৃদ্ধ বর্ণালী তথ্য ব্যবহার করে ।
৪.১ অরৈখিক বর্ণালী মিশ্রণ মডেল এবং লিনিয়ার বর্ণালী মিশ্রণ মডেল
বস্তুগুলির মিশ্রণ এবং দৈহিক বিতরণের স্থানিক স্কেল অ-লিনিয়ারিটির ডিগ্রি নির্ধারণ করে। বড় আকারের বর্ণালী মিশ্রণটি একটি রৈখিক মিশ্রণ হিসাবে বিবেচনা করা যেতে পারে, এবং দুটি ছোট স্কেলে অভ্যন্তরীণ ছোট-পারমাণবিক মিশ্রণটি লিনিয়ার নয়। হাইপারস্পেকট্রাল অ্যাপ্লিকেশনগুলিতে, অ-লিনিয়ার মডেল ব্যবহার করে গণনা করা ফলাফলগুলি লিনিয়ার মডেল ব্যবহার করে গণনা করা তুলনায় ভাল তবে তাদের প্রচুর পরিমাণে পরামিতি ইনপুট করা দরকার practical এই ব্যবহারিক প্রয়োগটি অসুবিধা নিয়ে আসে।
ননলাইনার মডেল
হ্যাপকে মিশ্র বর্ণালী মডেল
কেএম (কুবল্ক-মুনক) মিশ্র বর্ণালীটির তাত্ত্বিক মডেল
তেজস্ক্রিয় চ্যানেল ঘনত্ব তত্ত্বের উপর ভিত্তি করে উদ্ভিদ এবং মাটির বর্ণালী সংকর মডেল
বিক্রয় মডেল
PROSPECT এবং PROSAIL মডেল
লিনিয়ার মডেল (এলএসএমএম)
স্থল বস্তুর মধ্যে যখন ঘটনার আলোর কোনও একাধিক ছড়িয়ে ছিটিয়ে থাকে না, নির্দিষ্ট আইএফওভের মধ্যে গঠিত মিশ্র পিক্সেলগুলি লিনিয়ার মিক্সিং মডেল (এলএসএমএম) দ্বারা বর্ণনা করা যায়।
৪.২ বর্ণালী ডেমিক্সিং
মিশ্র পিক্সেল সমস্যা সমাধানের প্রক্রিয়াটিকে মিশ্র পিক্সেল পচন বা বর্ণালী ডেমিক্সিং বলা হয় , যা প্রতিটি মিশ্র পিক্সেলের মাধ্যমে কোন খাঁটি পিক্সেল মিশ্রিত হয় এবং কীভাবে, দূরবর্তী সেন্সিং চিত্রের সরবরাহিত তথ্যের ভিত্তিতে নির্ধারণ করা হয়। তবে, কঠোর অর্থে খাঁটি পিক্সেলগুলি আসলে বিদ্যমান নেই, সুতরাং অনিমিক্স করার সময় সাধারণত খাঁটি পিক্সেলগুলি পিক্সেলের সাথে প্রতিস্থাপন করে যা চিত্রের বৈশিষ্ট্যগুলির একটি নির্দিষ্ট অনুপাত থাকে । খাঁটি পিক্সেলের পরিবর্তে এই আনুমানিক বিশুদ্ধ পিক্সেলগুলিকে শেষ উপাদানগুলি বলা হয় ।
লিনিয়ার ভুতুড়ে unmixing রিমোট সেন্সিং ইমেজ LSMM ব্যবহার এক্সএক্সচিত্রের প্রতিটি মিশ্র পিক্সেল তার শেষ উপাদানগুলিতে বিভক্ত হয় এবং শেষ উপাদান ম্যাট্রিক্স ই প্রাপ্ত করতে সংশ্লিষ্ট প্রাচুর্য হয়ই আর ম্যাট্রিক্স প্রাচুর্য (অর্থাত, শতকরা) একটিএকজনপ্রক্রিয়া। যে
এক্সএল × এন= ইল × মিএকজনm × n+ + [Epsilon]এল × এন
এক্সএল×এন=ইএল×মিএকজনমি×এন+ +εএল×এন
দুই ধাপ প্রাথমিক অপারেশন: সেল নিষ্কাশন দল যেমন, নির্ণয় ইই, প্রচুর পরিমাণে বিপর্যয়, এটি A নির্ধারণ করুনএকজন।
শেষ উপাদানগুলির সংখ্যা নির্ধারণ করুন.পিসিএ কয়েকটি ব্যান্ডের বহু বর্ণালী চিত্রগুলিতে কোভেরিয়েন্স ইগেনভ্যালুগুলির আকার নির্ধারণ করতে ব্যবহার করা যেতে পারে Ne নেইমার-পিয়ারসন সনাক্তকরণ তত্ত্বের বৈশিষ্ট্য প্রান্তিক বিশ্লেষণ বিশ্লেষণ পদ্ধতিটি হাইপারস্পেকট্রাল নির্ধারণের জন্য ব্যবহৃত হয়। বর্ণালী মাত্রা সজ্জা (এসএসডিসি) পদ্ধতি ব্যবহার করে শোরগোল মূল্যায়ন করা যেতে পারে;
টার্মিনাল উপাদান এক্সট্রাকশন: ম্যাক্সভি পদ্ধতিটি টার্মিনাল উপাদান নিষ্কাশনের জন্য সরাসরি ব্যবহৃত হয় N এন-ফাইন্ডার পদ্ধতিটি প্রথমে মাত্রা হ্রাস করতে হবে এবং তারপরে টার্মিনাল উপাদানগুলি বের করতে হবে When যখন মাত্রা হ্রাস ব্যবহৃত হয়, নিষ্কাশন প্রভাব: এমa x V> এমএনএফ> এমএকজন এফ> গপিসিএ > এসপিসিএকজনএমএকটিএক্সভী>এমএনএফ>এমএকজনএফ>সিপিসিএকজন>এসপিসিএকজন ;
শেষ-উপাদান বর্ণালী পরিবর্তনশীলতা: অ-রৈখিক কারণগুলির প্রভাবের কারণে, শেষ-উপাদান বর্ণালীটির পরিবর্তনশীলতা রয়েছে, অর্থাৎ একই ধরণের একাধিক প্রান্ত-উপাদান রয়েছে, যা লিনিয়ার বর্ণালী ডেমিক্সিং ত্রুটির জন্য অন্যতম প্রধান কারণ। মিশ্র পিক্সেল এবং শেষ উপাদানগুলির বর্ণালী পরিবর্তনশীলতা হ'ল উদ্দেশ্য বিষয়গুলির অনিশ্চিত বিবরণ, যা ফাজি সাবটস এবং ফাজি ব্যবস্থাগুলির ধারণার মাধ্যমে সমাধান করা যেতে পারে;
সাধারণত ব্যবহৃত উপাদানগুলির নিষ্কাশন পদ্ধতিগুলি হ'ল:
খাঁটি পিক্সেল সূচক (পিপিআই) অ্যালগরিদম;
উন্নত দ্রুত Iterative পিপিআই (এফআইপিপিআই) অ্যালগরিদম;
অভ্যন্তরীণ সর্বাধিক ভলিউম (এন-ফাইন্ডার) অ্যালগরিদম;
ভার্টেক্স উপাদান উপাদান বিশ্লেষণ (ভিসিএ) অ্যালগরিদম;
সর্বাধিক দূরত্বের (ম্যাক্সডি) অ্যালগরিদমের ভিত্তিতে;
সর্বাধিক ভলিউম (ম্যাক্সভি) অ্যালগরিদমের উপর ভিত্তি করে;
কোয়ানটিটিভেটিভ ইন্ডিপেন্ডেন্ট কম্পোনেন্ট (আইসিএ) এবং এর ডেরাইভেটিভ অ্যালগরিদমগুলি।
যখন আমরা শেষ-উপাদান ম্যাট্রিক্স ই পাই getইমধ্য দিয়ে যাচ্ছে পর প্রাচুর্য বিপর্যয় প্রতিটি endmember অনুপাত অর্থাত প্রতিটি পিক্সেল hyperspectral ইমেজ সমাধান খুঁজে ম্যাট্রিক্স প্রাচুর্য একটিএকজন প্রক্রিয়া।
সাধারণ পদ্ধতিগুলি হ'ল:
স্বল্প স্কোয়ার (এলএস):
নিয়ন্ত্রণহীন (ইউসিএলএস)
"সমষ্টি 1" প্রতিবন্ধকতা (এসসিএলএস)
অ-নেতিবাচক সীমাবদ্ধতা (এনসিএলএস)
সম্পূর্ণ সীমাবদ্ধতা (এফসিএলএস)
ফিল্টার ভেক্টর (এফভি) পদ্ধতি
আইট্রেটিভ স্পেকট্রাল হাইব্রিড অ্যানালাইসিস (আইএসএমএ) পদ্ধতি ইত্যাদি
৫. হাইপারস্পেকট্রাল রিমোট সেন্সিং ডেটার তদারকি করা শ্রেণিবিন্যাস
হাইপারস্পেক্ট্রাল ইমেজ ডেটা বৈশিষ্ট্য বর্ণালী তথ্য এবং চিত্রের তথ্যকে একীভূত করে এবং এর ডেটাতে দুটি ধরণের এক্সপ্রেশন থাকে: জ্যামিতিক স্থান এবং বর্ণালী বৈশিষ্ট্য স্থান।
জ্যামিতিক স্থান : চিত্রের প্রতিটি পিক্সেলের স্থানিক অবস্থান এবং তার আশেপাশের পিক্সেলের মধ্যে পারস্পরিক সম্পর্ককে দৃশ্যত প্রকাশ করুন এবং হাইপারস্পেকট্রাল চিত্র প্রক্রিয়াকরণের জন্য স্থানিক তথ্য সরবরাহ করুন।
বর্ণালী বৈশিষ্ট্য স্থান : হাইপারস্পেকট্রাল রিমোট সেন্সিং চিত্রের প্রতিটি পিক্সেল একাধিক ইমেজিং ব্যান্ডের প্রতিবিম্ব মানগুলির সাথে মিলে যায়। একটি আনুমানিক ধারাবাহিক বর্ণাল বক্ররেখাকে এন হিসাবে প্রতিনিধিত্ব করা হয়এনডাইমেনশন ভেক্টর: বিভিন্ন ব্যান্ডে ভেক্টরের মান পরিবর্তন হ'ল এটি প্রতিনিধিত্ব করে এমন টার্গেটের রেডিয়েশনের বর্ণালী সম্পর্কিত তথ্য প্রতিফলিত করে advantage এর সুবিধাটি বৈশিষ্ট্য মাত্রা পরিবর্তন এবং স্কেলাবিলিটি। আমরা হাইপারস্পেকট্রাল পিক্সেলগুলিকে একটি উচ্চ-মাত্রিক বৈশিষ্ট্যযুক্ত স্থানের ডেটা পয়েন্ট হিসাবে বিবেচনা করি এবং ডেটাগুলির পরিসংখ্যানগত বৈশিষ্ট্যের উপর ভিত্তি করে একটি শ্রেণিবদ্ধকরণ মডেল তৈরি করি তবে এর দুর্বলতা এটি পিক্সেলের মধ্যে জ্যামিতিক অবস্থানের সম্পর্ককে প্রকাশ করতে পারে না।
হাইপারস্পেকট্রাল ইমেজ ডেটার পরিমাণগত বিশ্লেষণের জন্য তত্ত্বাবধানযুক্ত শ্রেণিবিন্যাস প্রায়শই ব্যবহৃত হয় মূল প্রক্রিয়াটি হ'ল: প্রতিটি চিত্রের প্রতিটি পিক্সেলের প্রতিটি শ্রেণির শ্রেণিবিন্যাস বৈশিষ্ট্যগুলি অর্জন করতে মেশিনের একটি জ্ঞাত শ্রেণীর সাথে সম্পর্কিত প্রশিক্ষণ নমুনাগুলি জানতে একটি শ্রেণিবদ্ধকারীর ব্যবহার; শ্রেণিবদ্ধকরণ সিদ্ধান্তের মানদণ্ডের ভিত্তিতে শ্রেণিবদ্ধকরণের মানদণ্ড।
সাধারণত এই পদক্ষেপগুলি অনুসরণ করুন:
হাইপারস্পেকট্রাল ডেটা নির্বাচন।
চিত্র প্রাকপ্রসেসিং। যা জ্যামিতিক নিবন্ধকরণ, ক্রমাঙ্কন ইত্যাদি সঠিক বর্ণালী এবং জ্যামিতিক তথ্য প্রাপ্ত হয়েছে তা নিশ্চিত করার জন্য to
বৈশিষ্ট্যগুলির ধরণ নির্ধারণ করুন। এটি, শ্রেণিবদ্ধকরণ বিভাগটি নিষ্কাশিত প্রশিক্ষণের ডেটা বৈশিষ্ট্য অনুসারে নির্ধারিত হয়।
প্রশিক্ষণের নমুনা নির্বাচন করুন।
বৈশিষ্ট্য নিষ্কাশন এবং বৈশিষ্ট্য নির্বাচন। শ্রেণিবদ্ধকরণের নির্ভুলতা উন্নত করতে বিভিন্ন ধরণের স্থল বৈশিষ্ট্যগুলির মধ্যে সর্বাধিক পৃথক বৈশিষ্ট্যগুলি নির্বাচন করুন।
শ্রেণিবিন্যাসের জন্য উপযুক্ত শ্রেণিবদ্ধকরণ পদ্ধতিটি নির্বাচন করুন।
শ্রেণিবদ্ধকরণ প্রক্রিয়াজাতকরণ। প্রচলিত পিক্সেল শ্রেণিবদ্ধকরণ পদ্ধতির উপর ভিত্তি করে শ্রেণিবিন্যাসের পরে প্রচুর শব্দ এবং বিচ্ছিন্ন পিক্সেল হতে পারে the গ্রাউন্ড বৈশিষ্ট্যগুলির ধারাবাহিকতা অনুসারে, মূল উপাদানগুলির ফিল্টারিংয়ের মতো পদ্ধতিগুলি এই ফ্যাক্টরের প্রভাব হ্রাস করতে এবং খুর থেকে শ্রেণিবিন্যাসের নির্ভুলতা উন্নত করতে ব্যবহৃত হয়।
শ্রেণিবিন্যাস ফলাফল মূল্যায়ন। শ্রেণিবিন্যাসের নির্ভুলতা এবং নির্ভরযোগ্যতা নিশ্চিত করার জন্য পরীক্ষার তথ্য বিভাগের শ্রেণিবিন্যাসকে জ্ঞাত ফলাফলের সাথে তুলনা করুন।
5.1 বর্ণালী বৈশিষ্ট্য জায়গার উপর ভিত্তি করে শ্রেণিবদ্ধকরণ
বর্ণাল বৈশিষ্ট্য জায়গার উপর ভিত্তি করে হাইপারস্পেকট্রাল ইমেজ শ্রেণিবদ্ধকরণ পদ্ধতিটি মূলত হাইপারস্পেকট্রাল চিত্রগুলির বর্ণালি বৈশিষ্ট্যগুলি নিষ্কাশন এবং রূপান্তরের উপর ভিত্তি করে ideas এটি দুটি ধারণাে বিভক্ত: একটি হ'ল বৈশিষ্ট্যের শারীরিক এবং অপটিকাল বৈশিষ্ট্যের বর্ণালী বক্ররেখার উপর ভিত্তি করে বৈশিষ্ট্য সম্পাদন করা স্বীকৃতি, প্রতিনিধি পদ্ধতি বর্ণাল বৈশিষ্ট্য মেলানো পদ্ধতি; অন্যটি একটি বৈশিষ্ট্য স্থান- ভিত্তিক শ্রেণিবদ্ধকরণ পদ্ধতি যা মূলত শ্রেণিবিন্যাসের মডেল প্রতিষ্ঠার জন্য উপাত্তের পরিসংখ্যানগত বৈশিষ্ট্যগুলি ব্যবহার করে। প্রধান পদ্ধতি হ'ল traditionalতিহ্যবাহী দূরবর্তী সংবেদনের শ্রেণিবদ্ধকরণ পদ্ধতি এবং স্নায়ুতাল নেটওয়ার্ক, সমর্থন ভেক্টর মেশিন এবং অন্যান্য জটিল পদ্ধতি। চিত্র শ্রেণিবদ্ধকরণ পদ্ধতি।
5.1.1 বর্ণালী বৈশিষ্ট্য মেলে শ্রেণিবদ্ধকরণ পদ্ধতি
বর্ণাল বক্রের উপর ভিত্তি করে শ্রেণীবদ্ধকরণ এবং স্বীকৃতি হ'ল বর্ণালী গ্রন্থাগারে পরিচিত বর্ণাল ডেটা ব্যবহার করা এবং চিত্রের গ্রাউন্ড কভারের ধরণ চিহ্নিত করার জন্য ম্যাচিং অ্যালগরিদম ব্যবহার করা। এই মিলটি হয় পুরো বর্ণালী জুড়ে একটি তুলনা, বা আগ্রহের ব্যান্ডের বর্ণালি তুলনা হতে পারে।
বর্ণালীর মধ্যে সর্বনিম্ন দূরত্বের উপর ভিত্তি করে ম্যাচিং অ্যালগরিদম হল এমন একটি শ্রেণিবদ্ধকরণ পদ্ধতি যা অজানা বর্ণালী এবং রেফারেন্স বর্ণালীগুলির মধ্যে দূরত্ব গণনা করে এবং তারপরে ন্যূনতম স্কোয়ারের নীতি অনুসারে মেলে। এই পদ্ধতিটি শব্দের প্রতি সংবেদনশীল, তাই ম্যাচের আগে প্রাক-প্রস্রোসেসিংয়ের প্রয়োজন হয়।
বর্ণালী কোণ ম্যাপিং (এসএএম) পদ্ধতি বর্ণালী স্থানের বহুমাত্রিক ভেক্টর হিসাবে বর্ণালীকে বিবেচনা করে এবং দুটি বর্ণালী ভেক্টরের মধ্যকার সাধারণ কোণ গণনা করে The বর্ণালী শ্রেণিবদ্ধ করা হয়। এসএএম পদ্ধতির স্বতন্ত্র বৈশিষ্ট্য হ'ল অন্তর্ভুক্ত কোণ মূল্যটির বর্ণালী ভেক্টর মডুলাসের সাথে কোনও সম্পর্ক নেই, এবং কেবল বর্ণালীর আকারের মিলের সাথে তুলনা করে, এটি পূর্বের থেকে এসএএম পদ্ধতির পার্থক্য এবং সুবিধাও।
নির্দিষ্ট শারীরিক অর্থ হাইপারস্পেকট্রাল ইমেজের বর্ণাল ব্যান্ডগুলির মধ্যে আবদ্ধ হয় এবং বর্ণালী বক্ররের আকৃতি বৈশিষ্ট্যটি স্থল বৈশিষ্ট্যের অভ্যন্তরীণ শারীরিক এবং রাসায়নিক বৈশিষ্ট্যের বহিরাগত প্রতিচ্ছবি।
5.1.2 রিমোট সেন্সিং ইমেজ স্ট্যাটিস্টিকাল মডেলগুলির শ্রেণিবদ্ধকরণ
পরিসংখ্যান-ভিত্তিক সর্বাধিক সম্ভাবনার শ্রেণিবিন্যাস হ'ল প্রচলিত দূরবর্তী সংবেদনশীল চিত্রের শ্রেণিবিন্যাসে সর্বাধিক ব্যবহৃত শ্রেণিবদ্ধকরণ পদ্ধতি the সর্বাধিক সম্ভাবনার শ্রেণিবদ্ধে শ্রেণিবিন্যাস প্রক্রিয়াটিকে সহজতর করার জন্য, হাইপারস্পেকট্রাল ইমেজের প্রতিটি ধরণের বৈশিষ্ট্যের সম্ভাব্যতা ঘনত্ব বহু-মাত্রিকতার সাপেক্ষে ass সাধারণ বিতরণ, তার সম্ভাব্যতা ঘনত্ব ফাংশনটি পাওয়ার জন্য পরিসংখ্যানগত পরামিতিগুলি অনুমান করার জন্য শ্রেণিবিন্যাস প্রশিক্ষণের নমুনাগুলি ব্যবহার করুন এবং শেষ পর্যন্ত সর্বাধিক সম্ভাবনার সূত্রটি পরিবর্তন করতে বায়েস সূত্রটি ব্যবহার করুন
পি ( এক্স | ডাব্লু)আমি) পি ( ডাব্লুআমি) ≥ পি ( x | ডাব্লুঞ) পি ( ডাব্লুঞ)
পি(এক্স|Wআমি)পি(Wআমি)≥পি(এক্স|Wঞ)পি(Wঞ)
যেখানে পি(ডাব্লু)আমি)পি(Wআমি)এবং পি(ডাব্লুঞ)পি(Wঞ)ক্লাস iআমিক্লাস জেঞএ এর পূর্ব সম্ভাবনা বন্টন সমান বলে ধরে নেওয়া হয় কারণ এটি অনুশীলন করে অনুমান করা যায় না। অতএব, প্রকৃত শ্রেণিবদ্ধকরণ প্রক্রিয়াতে, প্রতিটি পিক্সেল এটি চিত্রের বিভিন্ন বিভাগের অন্তর্গত সম্ভাবনার বৃহত একটিতে বিভক্ত হয়।
অসুবিধাগুলি: ভাল ফলাফল পাওয়ার জন্য, পরিসংখ্যানগত পরামিতিগুলির অনুমান খুব গুরুত্বপূর্ণ হয়ে ওঠে; নির্ভরযোগ্য পরামিতিগুলি পেতে, প্রতিটি বিভাগের জন্য পর্যাপ্ত প্রশিক্ষণের নমুনা থাকতে হবে, যা শত শত ব্যান্ড সহ হাইপারস্পেক্ট্রাল ইমেজের পক্ষে কঠিন।
5.1.3 হাইপারস্পেকট্রাল ইমেজ নিউরাল নেটওয়ার্ক পদ্ধতি
এটি গভীর শিক্ষার সর্বশেষ জ্ঞানের সাথে পরে বিস্তারিতভাবে পরিচয় করা হবে।
অসুবিধাগুলি: হাইপারস্পেকট্রাল ইমেজগুলিকে শ্রেণিবদ্ধকরণ করার সময়, আমরা প্রায়শই "একই বস্তু হেটেরোস্পেক্ট্রাম" কল্পনাটির মুখোমুখি হই, যা নিউরাল নেটওয়ার্ক শ্রেণিবদ্ধকরণ অ্যালগরিদমকে রূপান্তর করতে অসুবিধাজনক করে তোলে এবং শ্রেণিবদ্ধকরণের নির্ভুলতাটিকে গুরুতরভাবে হ্রাস করে।
5.1.4 হাইপারস্পেক্ট্রাল ইমেজ সমর্থন ভেক্টর মেশিন পদ্ধতি
হাইপারস্পেকট্রাল ইমেজ শ্রেণিবিন্যাসের জন্য সমর্থন ভেক্টর মেশিন পদ্ধতির সুবিধা হ'ল এটি মাত্রিক মাত্রা হ্রাস ছাড়াই উচ্চ মাত্রিক ডেটা প্রক্রিয়া করতে পারে এবং বর্ণালী তথ্যের পর্যাপ্ততা নিশ্চিত করে শ্রেণিবদ্ধ করতে সমস্ত ব্যান্ড ব্যবহার করে।
মূল এসভিএম অ্যালগরিদম একটি দ্বি-শ্রেণিবদ্ধকারী hyp হাইপারস্পেকট্রাল ইমেজের একাধিক শ্রেণিবদ্ধকরণ এবং সূক্ষ্ম শ্রেণিবিন্যাসে, একাধিক এসভিএম একত্রিত বা বহু শ্রেণিবিন্যাস অর্জনের জন্য ক্যাসকেড করা হয়।
5.2 হাইপারস্পেকট্রাল চিত্রের শ্রেণিবিন্যাস জ্যামিতিক স্থান এবং বর্ণালী বৈশিষ্ট্য স্পেসের সংমিশ্রণে
বর্ণাল বৈশিষ্ট্য জায়গার উপর ভিত্তি করে হাইপারস্পেকট্রাল ইমেজ শ্রেণিবিন্যাসের পদ্ধতি হাইডারস্পেকট্রাল ডেটাটিকে পিক্সেল পয়েন্টের জ্যামিতিক স্থানিক বৈশিষ্ট্য বিবেচনা না করে এবং হাইপারস্পেকট্রাল চিত্রগুলির জ্যামিতিক স্থানগত বৈশিষ্ট্য এবং বর্ণালী বৈশিষ্ট্যযুক্ত স্থানকে একীভূত করে গোষ্ঠীযুক্ত করার জন্য সেটকে একটি অযৌক্তিকভাবে ডেটা সেট হিসাবে গণ্য করা হয়। শ্রেণিবিন্যাস কার্যকরভাবে শ্রেণিবিন্যাসের নির্ভুলতার উন্নতি করতে পারে।
5.2.1 হাইপারস্পেকট্রাল চিত্র শ্রেণিবদ্ধকরণ সমজাতীয় অবজেক্ট এক্সট্রাকশন (ECHO) এর উপর ভিত্তি করে
জায়গা: চিত্রটির স্থানিক রেজোলিউশন বেশি (5 মিটারের চেয়ে ভাল) AVআরআইআরআইএস ডেটার মতো সাধারণ পরীক্ষামূলক ডেটা সেটগুলি প্রায় 20 মি
মূল ধারণা: প্রথমে চিত্রটিকে বিভিন্ন চিত্রের বস্তুগুলিতে বিভক্ত করুন এবং চিত্রের বিষয়গুলি একই আকার এবং বর্ণালী বৈশিষ্ট্যযুক্ত সমজাতীয় অঞ্চল; পিক্সেলগুলির জন্য যা সমজাতীয় অঞ্চলে শ্রেণিবদ্ধ করা হয়নি, অবশেষে শ্রেণিবদ্ধ করার জন্য সর্বাধিক সম্ভাবনার শ্রেণিবদ্ধ ব্যবহার করুন শ্রেণিবিন্যাসের ফলাফল পান।
5.2.2 টেক্সচার তথ্য দ্বারা সহায়তায় হাইপারস্পেকট্রাল চিত্রগুলির শ্রেণিবদ্ধকরণ
টেক্সচারের পরিসংখ্যানগুলির জন্য ধূসর-স্কেল সহ-ইভেন্ট ম্যাট্রিক্স ব্যবহৃত হয়।
5.3 হাইপারস্পেকট্রাল রিমোট সেন্সিং চিত্রগুলির অবজেক্ট-ভিত্তিক শ্রেণিবদ্ধকরণ
অবজেক্ট-ওরিয়েন্টেড শ্রেণিবিন্যাসের বৈশিষ্ট্য হ'ল শ্রেণিবিন্যাসের সর্বাধিক প্রাথমিক অবজেক্টটি পিক্সেল থেকে একটি চিত্রের অবজেক্টে রূপান্তরিত হয়। শ্রেণিবিন্যাসের মূল হ'ল হাইপারস্পেকট্রাল চিত্রগুলির বিভাজন this এই পর্যায়ে বর্ণালী তথ্য এবং স্থানিক তথ্য একত্রিত করা উচিত ।
উপরের চিত্রটি একটি অবজেক্ট-ভিত্তিক হাইপারস্পেকট্রাল ইমেজ শ্রেণিবদ্ধকরণ কাঠামো।
5.4 হাইপারস্পেকট্রাল চিত্রগুলির শ্রেণিবদ্ধতার যথার্থ মূল্যায়ন evalu
5.4.1 ত্রুটি ম্যাট্রিক্স
ত্রুটি ম্যাট্রিক্সের বডি হ'ল এক কে×কেট×ট বর্গক্ষেত্রের ম্যাট্রিক্সটিতে গ্রাউন্ড রেফারেন্স যাচাইকরণ তথ্য, আচরণের শ্রেণিবিন্যাসের ফলাফল, ম্যাট্রিক্সের তির্যক উপাদানগুলি সঠিক শ্রেণিতে শ্রেণিবদ্ধ পিক্সেলের সংখ্যার প্রতিনিধিত্ব করে এবং তির্যক ব্যতীত অন্য উপাদানগুলি বিযুক্তির ভুলকে প্রতিনিধিত্ব করে।
তাদের মধ্যে, উত্পাদকের নির্ভুলতা (পিএ)
পিএকজনআমি= এক্সi , iএক্স+ i
পিএকজনআমি=এক্সআমি,আমিএক্স+ +আমি
ব্যবহারকারীর নির্ভুলতা (ইউএ)
ইউএকজনআমি= এক্সi , iএক্সআমি +
ইউএকজনআমি=এক্সআমি,আমিএক্সআমি+ +
5.4.2 মিসিং ত্রুটি এবং একাধিক ত্রুটি
অনুপস্থিত ত্রুটি (ওই) i বিভাগে বোঝায়আমিত্রুটি ম্যাট্রিক্সে, অন্যান্য বিভাগে কতটি ভুল শংসায়িত করা হয়েছে, বিভাগ iআমিঅনুপস্থিত ত্রুটি
ও ইআমি= 1 - এক্সi , iএক্স+ i
হেইআমি=1-এক্সআমি,আমিএক্স+ +আমি
মাল্টি-পয়েন্ট ত্রুটি (সিই) হ'ল পিক্সেলের অন্যান্য বিভাগের আই- এর বিযুক্তিআমিএকটি বিভাগের মধ্যে, iআমিমাল্টি-পয়েন্ট ত্রুটিটি
সিইআমি= 1 - এক্সi , iএক্সআমি +
সিইআমি=1-এক্সআমি,আমিএক্সআমি+ +
5.4.3 কাপা বিশ্লেষণ
দূরবর্তী সংবেদনের শ্রেণিবদ্ধকরণ মানচিত্র এবং রেফারেন্স ডেটার মধ্যে সামঞ্জস্যতা বা নির্ভুলতার পরিমাণগতভাবে মূল্যায়ন করার জন্য কাপা বিশ্লেষণ এমন একটি পদ্ধতি যা সামগ্রিক চিত্রটির শ্রেণিবিন্যাস ত্রুটি চিহ্নিত করতে পারে।
কেএকটি পি পি একটি = মোট শরীর স্পষ্টতা ডিগ্রী - এর ওয়াং স্পষ্টতা এর। 1 - এর ওয়াং স্পষ্টতা এর
কেএকটিপিপিএকটি=সার্বিকশরীরজরিমানাডিগ্রী-কালহোপজরিমানাডিগ্রী1-কালহোপজরিমানাডিগ্রী
গণিত
কেa p p a = NΣটi = 1এক্সi , i- ∑টi = 1( এক্সআমি +। X+ i)এন2- ∑টi = 1( এক্সআমি +। X+ i)
কেএকটিপিপিএকটি=এনΣআমি=1টএক্সআমি,আমি-Σআমি=1ট(এক্সআমি+ +×এক্স+ +আমি)এন2-Σআমি=1ট(এক্সআমি+ +×এক্স+ +আমি)
Hyp. হাইপারস্পেকট্রাল চিত্রগুলির অসমীক্ষিত শ্রেণিবিন্যাস
হাইপারস্পেকট্রাল ইমেজগুলির জন্য অপ্রচলিত শ্রেণিবদ্ধকরণ অ্যালগরিদমগুলি এখনও ট্র্যাডিশনাল রিমোট সেন্সিংগুলিতে অ - নিরীক্ষণ পদ্ধতিগুলি ব্যবহার করে, যেমন কে-মানে অ্যালগরিদম , আইএসওডাটা অ্যালগরিদম , এফসিএম অ্যালগরিদম এবং তাদের অপ্টিমাইজেশন অ্যালগরিদমগুলিতে।
হাইপারস্পেকট্রাল ইমেজগুলির নিরীক্ষণযোগ্য শ্রেণিবিন্যাস ব্যবহার করার সময় সচেতন হওয়ার জন্য কয়েকটি বিষয় রয়েছে:
হাইপারস্পেকট্রাল চিত্রগুলিতে অনেকগুলি ব্যান্ড থাকে এবং স্ব-শিক্ষার সময় প্রচুর অতিরিক্ত বাড়াবাড়ি উত্পন্ন হবে class শ্রেণিবিন্যাসের আগে বৈশিষ্ট্য নিষ্কাশন এবং নির্বাচন স্ব-শিক্ষার প্রক্রিয়াটির দক্ষতা উন্নত করতে সহায়ক;
এটি নিরীক্ষণযুক্ত শ্রেণিবিন্যাসে সহায়তা করার জন্য আরও সঠিক প্রাথমিক শ্রেণীর মানগুলি অর্জনের জন্য হাইপারস্পেকট্রাল চিত্রগুলিতে শেষ-উপাদান নিষ্কাশন এবং বর্ণালী বিশ্লেষণের পুরো ব্যবহার করতে পারে;
বৈষম্য পরিমাপটি নির্বাচন করার সময়, স্থল বৈশিষ্ট্যের বর্ণালী বৈশিষ্ট্যগুলি পুরোপুরি বিবেচনা করা এবং এটি যথাযথভাবে নির্বাচন করা প্রয়োজন;
নিরীক্ষণযুক্ত শ্রেণিবিন্যাস উদ্দেশ্য ফাংশনটি সমাধান করতে অনুসন্ধান অ্যালগরিদম ব্যবহার করার সময়, অকার্যকর শ্রেণিবিন্যাসের যথার্থতা উন্নত করতে স্থানীয় অনুসন্ধান অ্যালগরিদমের পরিবর্তে বিশ্বব্যাপী অনুসন্ধান অ্যালগরিদম ব্যবহার করার চেষ্টা করুন।
Foreword
This document summarizes the basic knowledge of concept definition, analysis and classification of hyperspectral remote sensing images. The first part introduces the general principle and knowledge of hyperspectral image, the second part introduces the noise problem of hyperspectral image; the third part introduces the data redundancy problem of hyperspectral image and the method of data dimension reduction to solve the redundancy; The problem of mixed pixels in hyperspectral images introduces a certain degree of spectral demixing. The fifth and sixth sections introduce the characteristics, processes, and algorithms of supervised classification and sub-supervised classification of hyperspectral images, respectively.
1. Basic introduction
Hyperspectral remote sensing is a multi-dimensional information acquisition technology that combines imaging technology and spectral technology, and simultaneously detects the two-dimensional collection space of the target and one-dimensional spectral information to obtain continuous, narrow-band image data with high spectral resolution.
Hyperspectral and high-resolution images , multispectral images
Hyperspectral recognition advantages:
The spectral resolution is high and the number of bands is high. It can obtain almost continuous spectral characteristic curves of ground features, and can select or extract specific bands to highlight target features according to needs;
At the same spatial resolution, the spectral coverage is wider, and the response characteristics of ground objects to electromagnetic waves can be detected;
Multiple bands, which facilitates the mutual correction between the bands;
Quantitative continuous spectral curve data provides the conditions for the introduction of image classification by the model of ground surface spectral mechanism;
Contains a wealth of radiation, space and spectral information, is a comprehensive carrier of a variety of information.
Difficulties in identifying hyperspectral:
Large amount of data, the image contains dozens to hundreds of bands, the amount of data is hundreds of times that of the single-band remote sensing image; there is a lot of redundancy in the data, and improper processing will affect the classification accuracy;
The classification of hyperspectral images requires higher accuracy of spectral calibration and reflectance conversion on the one hand, and it is difficult to preprocess image data due to the complex imaging mechanism and huge data volume, including atmospheric correction, geometric correction, Spectral calibration and reflectance conversion;
There are many bands and high correlation between bands, so the number of training samples required for classification has greatly increased, and the training parameters obtained are often unreliable due to insufficient training samples (dimensional disaster);
Conventional remote sensing processing models and methods cannot meet the needs of hyperspectral image classification. One of the main problems is the parameter estimation problem of the statistical classification model, which requires high selection of spectral features.
Hughes phenomenon in hyperspectral image classification:
Hughes phenomenon: the limited data sample in the machine learning problem, it is necessary in the high-dimensional feature space (each feature can take on a range of possible values) in learning a "state of nature" (possibly infinite distribution), requires considerable The amount of training data contains some sample combinations. Given a fixed number of training samples, its predictive power decreases with increasing dimensions.
In hyperspectral remote sensing images, when the number of training samples is limited, the classification accuracy increases first with the number of image bands. After reaching a certain extreme value, the classification accuracy decreases with the number of bands.
The traditional remote sensing image analysis uses image spatial information, and the core of hyperspectral image analysis is spectral analysis
The figure above is the remote sensing image of a certain band and the spectral characteristic of a pixel.
2. Noise processing of hyperspectral data
Fine spectral data of hyperspectral images can fully reflect the subtle features of the ground feature spectrum. According to the relative differences in the spectral characteristics of different features, the feature classification can be realized, and target detection and fine classification can be realized.
However, due to the lack of light imaging energy due to the dense channel of the imaging spectrometer, it is more difficult to improve the signal-to-noise ratio (SNR) of hyperspectral images compared to panchromatic images . In the process of acquiring image data, the features of the ground features are prone to "distortion" under the influence of noise. In addition, due to the large amount of hyperspectral data, in the fine classification process, it is often necessary to perform dimensionality reduction processing, and in the process of dimensionality reduction, it is necessary to retain the signal and compression noise to the greatest extent, so accurate noise evaluation is necessary. In addition, noise has the most direct impact on the results of fine classification. Therefore, noise assessment is needed for hyperspectral data.
The main noise is considered to be Gaussian white noise, which is divided into additive noise and multiplicative noise.
There are three main methods for noise evaluation: laboratory method, dark current method and image method. Because the first two methods are difficult to implement in experiments, the third one, the image method , is widely used .
The image method is divided into the following types:
Uniform area method (HA)
The main idea is to select more than four uniform regions from the image and obtain the estimated value of image noise by calculating the average of the standard deviation of these uniform regions.
Disadvantages: Uniform region selection needs to be performed manually and cannot be automated; uniform regions that meet the conditions do not exist in most remote sensing maps; noise estimation of subregions cannot represent the noise of the entire image.
Geostatistical Method (GS)
The main idea: select several uniform narrow bands from the image, and realize the estimation of image noise by calculating the semi-variance function of these narrow bands. To a certain extent, the spatial correlation of imaging spectral data is used.
Disadvantage: Similar to the uniform area method.
Local Mean and Local Standard Deviation (LMLSD)
Main idea: Assume that the image is composed of a large number of uniform small blocks, and the noise is mainly additive noise. Using the concepts of local mean and local standard deviation, the image is divided into many small blocks, and then the standard deviation of these sub-blocks is calculated as the size of the local noise, and the average value of the local standard deviations containing the most sub-block interval is selected as the entire image. Best noise estimate.
Disadvantages: Only valid for white Gaussian noise. For images with random Gaussian noise, the signal is disturbed by noise.
Spatial / spectral dimension decorrelation (SSDC)
The main idea: It is a noise assessment method specifically for hyperspectral images. It uses the characteristics of high correlation between the spatial and spectral dimensions of hyperspectral images, removes highly correlated signals through multivariate linear regression, and uses the resulting residual image pairs. Noise is estimated.
Evaluation: This method is less affected by the type of ground cover and can be automatically executed. It is a relatively stable method for evaluating hyperspectral image noise.
3. Common methods of dimensionality reduction of hyperspectral image data
The large number of spectral bands in hyperspectral remote sensing images provide extremely rich information for feature extraction, which is conducive to finer feature classification. However, the increase of bands will also lead to information redundancy and increased data processing complexity. .
Data dimensionality reduction meets the following conditions: retain the characteristic information of the data as much as possible; remove data redundancy and correlation.
Dimension reduction is mainly performed from two aspects of feature selection and feature extraction .
3.1 Feature selection
Feature selection is spectral combination, that is, the number of bands from the original spectrum is NNSelect M in the bandMBands (N> M)(N>M), The number of possible spectral combinations is
N!M! ( N− M) !
N!M!(N−M)!
Here you can use the Band Index method to reduce the spectral band selection.
* Band Index method: * Hyperspectral remote sensing image is divided into K according to correlationKGroups (such as shortwave light, visible light, near-infrared), let the number of bands in each group be nl( l = 1 , 2 , ⋯ , k )nl(l=1,2,⋯,k). Use pi jpijRepresents band iiWith band jjCorrelation coefficient, σiσiRepresents band iiVariance, RaRaRepresents band iiSum of the absolute values of correlation coefficients of other bands in different groups, RwRwRepresents band iiThe mean of the absolute values of the correlation coefficients with other bands in the same group, then
Rw= 1nl∑ | pi j|
Rw=1nl∑|pij|
And thus band iiThe Band Index can be expressed as:
Pi= σiRa+ Rw
Pi=σiRa+Rw
Through observation, we know that as the variance increases, the more information the band contains; as the correlation coefficient decreases, the independence of the band is higher.
The Band Index is an important parameter that reflects the overall inclusion of feature information and correlations in the band.
By combining the Band Index and the effective spectral range of object of the target object , we can select the band and then identify and classify it in the next step.
3.2 Feature extraction
Hyperspectral data dimensionality reduction technology is aimed at image feature extraction. It uses low-dimensional data to effectively express the characteristics of high-dimensional data, while also compressing the amount of data, which is more conducive to the rapid extraction of information. Data reduction includes a wide range of content. Hyperspectral remote sensing images are mainly based on reducing the spectral dimension and extracting the characteristics of the spectral dimension .
The feature selection in the previous section talked about the feature selection method in the original feature space to form a subspace of the original space. Next, the linear transformation method is introduced := B XY=BX From the high-dimensional data space, a suitable low-dimensional subspace (not a simple feature selection combination) is generated, so that the distribution of the data in this space can describe the original data in an optimal sense.
3.2.1 principal component analysis
Principal component analysis (PCA) is the most basic dimensionality reduction method for hyperspectral data, and it plays a huge role in hyperspectral data compression, decorrelation, noise reduction and feature extraction. The PCA transform is also known as the hotelling transform and the KL (karhunen-loeve) transform . The transformed principal component components are not related to each other, and the amount of information contained in the component decreases as the principal component number increases.
In the PCA transformation of hyperspectral remote sensing data, each band is generally treated as a vector. It is assumed that hyperspectral remote sensing data has ppBands, the image space dimension is m×nmXn, The specific processing flow:
Image vectorization: The input image data can be expressed as X=(x1, x2, ⋯ , xp)TX=(x1,x2,⋯,xp)TWhere xixiExpressed as an N× 1NX1Column vector, here N= m × nN=mXn. That is, the images are expanded by rows or columns and are regularly connected, which is called a vector.
Vector centralization: Subtract all vectors in the vector group from the vector of the vector's mean, that is, Y=X−E(X)Y=X−E(X).
Compute vector group YYCovariance matrix ΣX i.
Find the covariance matrix ΣX iEigenvalue matrix ΛΛAnd eigenvector matrix AA.
Principal component transformation, Z=ATYZ=ATY.
PCA transformation is an orthogonal linear transformation based on the amount of information. The transformed image information is mainly concentrated in the first few principal component components. The component components with small information quantities are discarded in the transform domain. An approximate image.
Based on the PCA transform, block-based principal component analysis method , directional principal component analysis method (DPCA), and selective principal component method (selective PCA)
However, there are two obvious flaws in the PCA transformation: one is that the numerical value transformation of the image has a significant effect; the other is that the signal-to-noise ratio after the transformation does not necessarily decrease with the increase of the principal component number. In response to these two problems, standardized PCA (SPCA) and residual-scaled PCA (RPCA) have been developed .
3.2.2 Maximum Noise Fraction Transformation
When the noise variance or the noise is unevenly distributed in each band of the image, the PCA method based on the maximum variance does not guarantee that the image quality decreases as the principal component increases. Therefore, a maximum noise fraction (MNF) transform is introduced here , and this transform arranges components according to the image quality. The MNF method mainly uses SNR and noise ratio to describe image quality parameters.
Suppose X=[x1, x2, ⋯ , xp]TX=[x1,x2,⋯,xp]TIs p×NpXN Matrix, mean vector of row vector group () = 0E(X)=0, Covariance matrix D() = ΣD(X)=X i , Assuming
X = S + N
X=S+N
Where SSAnd NNSignal and noise in the image, respectively, and they are not related.
Let ΣSX iSAnd ΣNX iNAre SSAnd NNCovariance matrix. Here it is assumed that the noise is additive, and the noise ratio can be expressed as:
V a r { N } / V a r { X }
Var{N}/Var{X}
The MNF transformation is a linear transformation.
Zi= aTiX , i = 1 , ⋯ , p
Zi=aiTX,i=1,⋯,p
ZiZiThe noise ratio is orthogonal to Z at allj( j = 1 , ⋯ , i − 1 )Zj(j=1,⋯,i−1)The largest of the components will be aiaistandardization,
aTiΣ ai= 1
aiTX iai=1
From this, the MNF transformation is expressed as:
Z = ATX
Z=ATX
In the formula, the linear transformation coefficient matrix A=[a1, a2, ⋯ , ap]A=[a1,a2,⋯,ap]Matrix Σ− 1X iNX i−1X iNEigenvector matrix, then
X i− 1X iNA = Λ A
X i−1X iNA=ΛA
Where the diagonal matrix ΛΛIs the eigenvalue matrix, iiEigenvalues λilambdai, The noise proportion of the corresponding component is
V a r { aTiN }V a r { aTiZ }= aTiX iNaiaTiΣ ai
Var{aiTN}Var{aiTZ}=aiTX iNaiaiTX iai
The components of the final transform result of the MNF transform are sorted according to the magnitude of the signal-to-noise ratio.
3.2.3 Other common transformations
Other common transform comprises a minimum / maximum autocorrelation factor analysis (Minimum / maximum autocorrelation factor, the MAF) , the noise adjusted principal component analysis (NPCA) , canonical correlation analysis (the CCA) , independent component analysis (Independent compnent Analysis, the ICA) , projection Pursuit (projection Pursuit, PP) , NMF and Nonlinear principal component analysis (Kernel PCA, KPCA)
Each of these methods has its own limitations and scope of application, and it is necessary to choose a suitable method according to the data quality and different application needs.
By summarizing the advantages and disadvantages of commonly used CPCA, SPCA, MAF, and MNF, and comparing the methods in the dimensionality reduction of hyperspectral data for target detection, the following performance analysis is obtained:
It can be summarized by the table as:
The advantage of CPCA is that the information loss is small, and the data structure after transformation is small, but this method is greatly affected by numerical values and noise;
The advantage of SPCA is that it is less affected by numerical values, and it is also good in both information retention and data structure retention, but this method is greatly affected by noise;
MNF is less affected by numerical values and noise, while the information loss is small, but the data structure after transformation is greatly affected;
MAF has the worst performance and is not suitable for dimensionality reduction of hyperspectral data in target detection
4. Hyperspectral image mixed pixels
Surface reflection or emission spectra remote sensor signal is acquired picture elements (pixel) in units of records. Since the hyperspectral imaging spectrometer in obtaining a large number of bands, each of which will lead to a weaker band radiation signals, in order to improve signal to noise ratio, image quality assurance, it is necessary to ensure a certain angle of the instantaneous field of view (IFOV) , and therefore, the phase The spatial resolution of hyperspectral images is lower than that of panchromatic and multispectral images, making the problem of mixed pixels particularly prominent.
Therefore, hyperspectral images cannot use traditional image spatial information for analysis. Instead, they use hundreds of bands of rich spectral information to mine image information from the spectral dimension .
4.1 Nonlinear Spectral Mixture Model and Linear Spectral Mixture Model
The mixing of objects and the spatial scale of the physical distribution determine the degree of non-linearity. Large-scale spectral mixing can be considered as a linear mixing, and internal small-nuclear mixing at two small scales is non-linear. In hyperspectral applications, the results calculated using the non-linear model are better than those calculated using the linear model, but they need to input a large number of parameters. This practical application brings difficulties.
Nonlinear model
Hapke mixed spectrum model
KM (KUBELK-MUNK) theoretical model of mixed spectrum
Spectral hybrid model of vegetation and soil based on radiation channel density theory
SAIL model
PROSPECT and PROSAIL models
Linear Model (LSMM)
When there is no multiple scattering of incident light between the ground objects, the mixed pixels formed within a certain IFOV can be described by a linear mixing model (LSMM).
4.2 Spectral demixing
The process of solving the mixed pixel problem is called mixed pixel decomposition or spectral demixing , which is to determine which pure pixels are mixed by each mixed pixel and how, based on the information provided by the remote sensing image. However, in the strict sense, pure pixels do not actually exist, so when unmixing, usually replace the pure pixels with pixels that contain a certain proportion of features in the image . These approximate pure pixels instead of pure pixels are called end elements .
Linear spectral demixing is the use of LSMM to remotely sense images XXEach mixed pixel in the image is decomposed into its end elements and the corresponding abundance to obtain the end element matrix EE And abundance of the matrix (i.e., percentage) AAthe process of. which is
XL × n= EL × mAm × n+ ϵL × n
XLXn=ELXmAmXn+εLXn
The basic work is divided into two steps: end element extraction, that is, determining EE, Abundance inversion, that is, determine AA.
Determine the number of end elements. PCA can be used to determine the size of the covariance eigenvalues in multi-spectral images of a few bands. The feature threshold analysis method of Neyman-Pearson detection theory is used to determine the hyperspectral. Noise can be evaluated using the spectral dimension decorrelation (SSDC) method);
Terminal element extraction: The MaxV method is directly used for terminal element extraction. The N-FINDER method needs to reduce the dimension first and then extract the terminal elements. When dimension reduction is used, the extraction effect is: Ma x V> MNF> MA F> CPCA > SPCAMaxV>MNF>MAF>CPCA>SPCA ;
End-element spectral variability: Due to the influence of non-linear factors, the end-element spectrum has variability, that is, there are multiple end-elements of the same type, which is also one of the main factors for linear spectral demixing errors. The spectral variability of mixed pixels and end-elements are uncertain descriptions of objective things, which can be solved by the idea of fuzzy subsets and fuzzy measures;
Commonly used end element extraction methods are:
Pure pixel index (PPI) algorithm;
Improved Faster Iterative PPI (FIPPI) algorithm;
Internal maximum volume (N-FINDER) algorithm;
Vertex component analysis (VCA) algorithm;
Based on the maximum distance (MaxD) algorithm;
Based on the maximum volume (MaxV) algorithm;
Quantitative Independent Component (ICA) and its derivative algorithms.
When we get the end-element matrix EEAfter going through the abundance inversion Solving hyperspectral image of each pixel in each endmember proportion, i.e. find the abundance of matrix AA the process of.
Common methods are:
Least squares (LS):
Unconstrained (UCLS)
"Sum Is 1" Constraint (SCLS)
Non-negative constraint (NCLS)
Full Constraint (FCLS)
Filter vector (FV) method
Iterative Spectral Hybrid Analysis (ISMA) method, etc.
5. Supervised classification of hyperspectral remote sensing data
Hyperspectral image data integrates the feature spectral information and image information, and its data has two types of expressions: geometric space and spectral feature space.
Geometric space : visually express the spatial position of each pixel in the image and the correlation between its surrounding pixels, and provide spatial information for hyperspectral image processing.
Spectral feature space : Each pixel of the hyperspectral remote sensing image corresponds to the reflection values of multiple imaging bands. An approximately continuous spectral curve is represented as an NNDimension vector. The change of the value of the vector in different bands reflects the radiation spectrum information of the target it represents. Its advantage is the change and scalability of the feature dimension. We treat hyperspectral pixels as data points in a high-dimensional feature space, and build a classification model based on the statistical characteristics of the data, but its weakness is that it cannot express the geometric position relationship between pixels.
Supervised classification is often used for the quantitative analysis of hyperspectral image data. The main process is: first, use a classifier to learn the training samples corresponding to a known class of machine to obtain the classification characteristics of each class of pixels on each image; Classification criteria based on classification decision criteria.
Generally follow these steps:
Hyperspectral data selection.
Image preprocessing. That is, geometric registration, calibration, etc., to ensure that the correct spectral and geometric information is obtained.
Determine the type of features. That is, the classification category is determined according to the extracted training data features.
Select training samples.
Feature extraction and feature selection. Select the most distinguishable features of various types of ground features to improve the classification accuracy.
Select the appropriate classification method for classification.
Post-classification processing. There may be a lot of noise and isolated pixels after classification based on the traditional pixel classification method. According to the continuity of the ground features, methods such as principal component filtering are used to reduce the influence of this factor and improve the classification accuracy from the hoof.
Evaluation of classification results. Compare the classification of the test data category with the known results to confirm the accuracy and reliability of the classification.
5.1 Classification based on spectral feature space
Hyperspectral image classification method based on spectral feature space is mainly based on the extraction and transformation of spectral features of hyperspectral images. It is divided into two ideas: one is to perform the feature based on the spectral curve of the physical and optical properties of the feature Recognition, the representative method is the spectral feature matching method; the other is a feature space- based classification method, which mainly uses the statistical characteristics of the data to establish a classification model. The main methods are traditional remote sensing classification methods and neural networks, support vector machines and other complex methods. Image classification method.
5.1.1 Classification method of spectral feature matching
The classification and recognition based on the spectral curve is to use the known spectral data in the spectral library and use the matching algorithm to identify the type of ground cover in the image. This matching can be either a comparison across the entire spectrum, or a spectral comparison of the band of interest.
The matching algorithm based on the minimum distance between spectra is a classification method that calculates the distance between the unknown spectrum and the reference spectrum, and then matches according to the least squares principle. This method is sensitive to noise, so denoising preprocessing is required before matching.
The spectral angle mapping (SAM) method treats the spectrum as a multi-dimensional vector in the spectral space, and calculates the generalized angle between the two spectral vectors. The smaller the angle, the more similar the spectra. Finally, the unknown pixels are based on the similarity threshold. The spectra are classified. The salient feature of the SAM method is that the included angle value has nothing to do with the spectral vector modulus, and only compares the similarity of the shapes of the spectra, which is also the difference and advantage of the SAM method from the former.
The specific physical meaning is implied between the spectral bands of the hyperspectral image, and the shape characteristic of the spectral curve is an external reflection of the intrinsic physical and chemical properties of the ground feature.
5.1.2 Classification of Remote Sensing Image Statistical Models
Statistics-based maximum likelihood classification is the most widely used classification method in traditional remote sensing image classification. In the maximum likelihood classifier, to simplify the classification process, it is assumed that the probability density of each type of feature in the hyperspectral image is subject to multi-dimensional Normal distribution, then use classification training samples to estimate statistical parameters to obtain its probability density function, and finally use Bayes formula to change the maximum likelihood formula
p ( x | wi) p ( wi) ≥ p ( x | wj) p ( wj)
p(x|wi)p(wi)≥p(x|wj)p(wj)
Where p(wi)p(wi)And p(wj)p(wj)Class iiWith class jjThe prior probability distribution of A is assumed to be equal because it cannot be estimated in practice. Therefore, in the actual classification process, each pixel is divided into the larger one of the probability that it belongs to different categories on the image.
Disadvantages: In order to obtain good results, the estimation of statistical parameters becomes very important; in order to obtain reliable parameters, there must be enough training samples for each category, which is difficult for hyperspectral images with hundreds of bands.
5.1.3 Hyperspectral Image Neural Network Method
It will be introduced in detail later with the latest knowledge of deep learning.
Disadvantages: When classifying hyperspectral images, we often encounter the "same object heterospectrum" imagination, which makes it difficult for neural network classification algorithms to converge and seriously reduces the classification accuracy.
5.1.4 Hyperspectral image support vector machine method
The advantage of the support vector machine method for hyperspectral image classification is that it can directly process high-dimensional data without dimensionality reduction, and uses all bands for classification, ensuring the adequacy of spectral information.
The original SVM algorithm is a two-classifier. In the multi-classification and fine classification of hyperspectral images, multiple SVMs are combined or cascaded to achieve multi-classification.
5.2 Hyperspectral image classification combining geometric space and spectral feature space
The method of hyperspectral image classification based on spectral feature space is to treat hyperspectral data as an unordered data set to be clustered without considering the geometric spatial characteristics of pixel points. Classification can effectively improve classification accuracy.
5.2.1 Hyperspectral Image Classification Based on Homogeneous Object Extraction (ECHO)
Premise: The spatial resolution of the image is high (better than 5m). Common experimental data sets such as AVIRIS Data are about 20m
The main idea: first divide the image into different image objects, and the image objects are homogeneous regions with similar shapes and spectral features; for the pixels that are not classified into the homogeneous region, use the maximum likelihood classifier to classify them finally Get classification results.
5.2.2 Classification of Hyperspectral Images Assisted by Texture Information
The gray-scale co-occurrence matrix is used for texture statistics.
5.3 Object-oriented classification of hyperspectral remote sensing images
The characteristic of object-oriented classification is that the most basic object of the classification is converted from a pixel to an image object. The core of classification is the segmentation of hyperspectral images . At this stage, spectral information and spatial information should be combined .
The figure above is an object-oriented hyperspectral image classification framework.
5.4 Classification accuracy evaluation of hyperspectral images
5.4.1 Error Matrix
The body of the error matrix is a k×kkXk The square matrix includes the ground reference verification information, the behavior classification result, the diagonal elements of the matrix represent the number of pixels classified into the correct category, and the elements outside the diagonal represent the error of misclassification.
Among them, producer accuracy (PA)
PAi= xi , ix+ i
PAi=xi,ix+i
User accuracy (UA)
UAi= xi , ixi +
UAi=xi,ixi+
5.4.2 Missing errors and multiple errors
Missing error (OE) refers to category iiIn the error matrix, how many are misclassified into other categories, category iiMissing error
O Ei= 1 − xi , ix+ i
OEi=1−xi,ix+i
Multi-point error (CE) is the misclassification of other categories of pixels to iiWithin a category, iiThe multi-point error is
CEi= 1 − xi , ixi +
CEi=1−xi,ixi+
5.4.3 Kappa analysis
Kappa analysis is a method to quantitatively evaluate the consistency or accuracy between remote sensing classification maps and reference data, and can identify the classification error of the overall image.
KA P P A = total body precision degree - of Wang precision of. 1 - of Wang precision of
Kappa=totalbodyfinedegree−periodhopefinedegree1−periodhopefinedegree
Calculated
Ka p p a = N∑ki = 1xi , i− ∑ki = 1( xi +× x+ i)N2− ∑ki = 1( xi +× x+ i)
Kappa=N∑i=1kxi,i−∑i=1k(xi+Xx+i)N2−∑i=1k(xi+Xx+i)
6. Unsupervised classification of hyperspectral images
The unsupervised classification algorithms for hyperspectral images still use the unsupervised methods in traditional remote sensing, such as K-means algorithm , ISODATA algorithm , FCM algorithm and their optimization algorithms.
There are several issues to be aware of when using unsupervised classification of hyperspectral images:
Hyperspectral images have many bands, and a lot of redundancy will be generated during self-learning. Feature extraction and selection before classification is helpful to improve the efficiency of the self-learning process;
It can make full use of end-element extraction and spectral analysis in hyperspectral images to obtain more accurate initial class values to assist unsupervised classification;
When selecting the dissimilarity measure, it is necessary to fully consider the spectral characteristics of the ground feature and select it appropriately;
When using the search algorithm to solve the unsupervised classification objective function, try to use the global search algorithm instead of the local search algorithm to improve the accuracy of the unsupervised classification.
0 comments:
Post a Comment