Hyperspectral remote sensing is a multi-dimensional information acquisition technology that combines imaging technology and spectral technology, and simultaneously detects the two-dimensional collection space of the target and one-dimensional spectral information to obtain continuous, narrow-band image data with high spectral resolution.
Hyperspectral image and a high resolution image , multi-spectral images different.
Hyperspectral recognition advantages:
- The spectral resolution is high and the number of bands is high. It can obtain almost continuous spectral characteristic curves of ground features, and can select or extract specific bands to highlight target features according to needs;
- At the same spatial resolution, the spectral coverage is wider, and the response characteristics of ground objects to electromagnetic waves can be detected;
- Multiple bands, which facilitates the mutual correction between the bands;
- Quantitative continuous spectral curve data provides the conditions for the introduction of image classification by the model of ground surface spectral mechanism;
- Contains a wealth of radiation, space and spectral information, is a comprehensive carrier of a variety of information.
Difficulties in identifying hyperspectral:
- Large amount of data, the image contains dozens to hundreds of bands, the amount of data is hundreds of times that of the single-band remote sensing image; there is a lot of redundancy in the data, and improper processing will affect the classification accuracy;
- The classification of hyperspectral images requires higher accuracy of spectral calibration and reflectance conversion on the one hand, and it is difficult to preprocess image data due to the complex imaging mechanism and huge data volume, including atmospheric correction, geometric correction, Spectral calibration and reflectance conversion;
- There are many bands and high correlation between bands, so the number of training samples required for classification has greatly increased, and the training parameters obtained are often unreliable due to insufficient training samples (dimensional disaster);
- Conventional remote sensing processing models and methods cannot meet the needs of hyperspectral image classification. One of the main problems is the parameter estimation problem of the statistical classification model, which requires high selection of spectral features.
Hughes phenomenon in hyperspectral image classification:
Hughes phenomenon: the limited data sample in the machine learning problem, it is necessary in the high-dimensional feature space (each feature can take on a range of possible values) in learning a "state of nature" (possibly infinite distribution), requires considerable The amount of training data contains some sample combinations. Given a fixed number of training samples, its predictive power decreases with increasing dimensions.
In hyperspectral remote sensing images, when the number of training samples is limited, the classification accuracy increases first with the number of image bands. After reaching a certain extreme value, the classification accuracy decreases with the number of bands.
The traditional remote sensing image analysis uses image spatial information. The core of hyperspectral image analysis is spectral analysis . Hyperspectral remote sensing data is a spectral image cube. Its main feature is the integration of the image space dimension and the spectral dimension information. Compared with a single band, it has more one-dimensional spectral information. While acquiring the surface space image, the spectral information of each object corresponding to each pixel will be obtained.
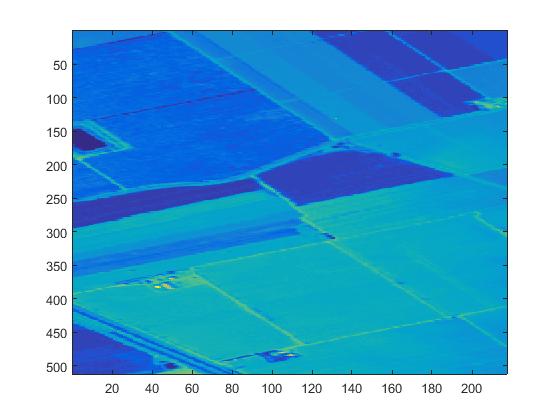
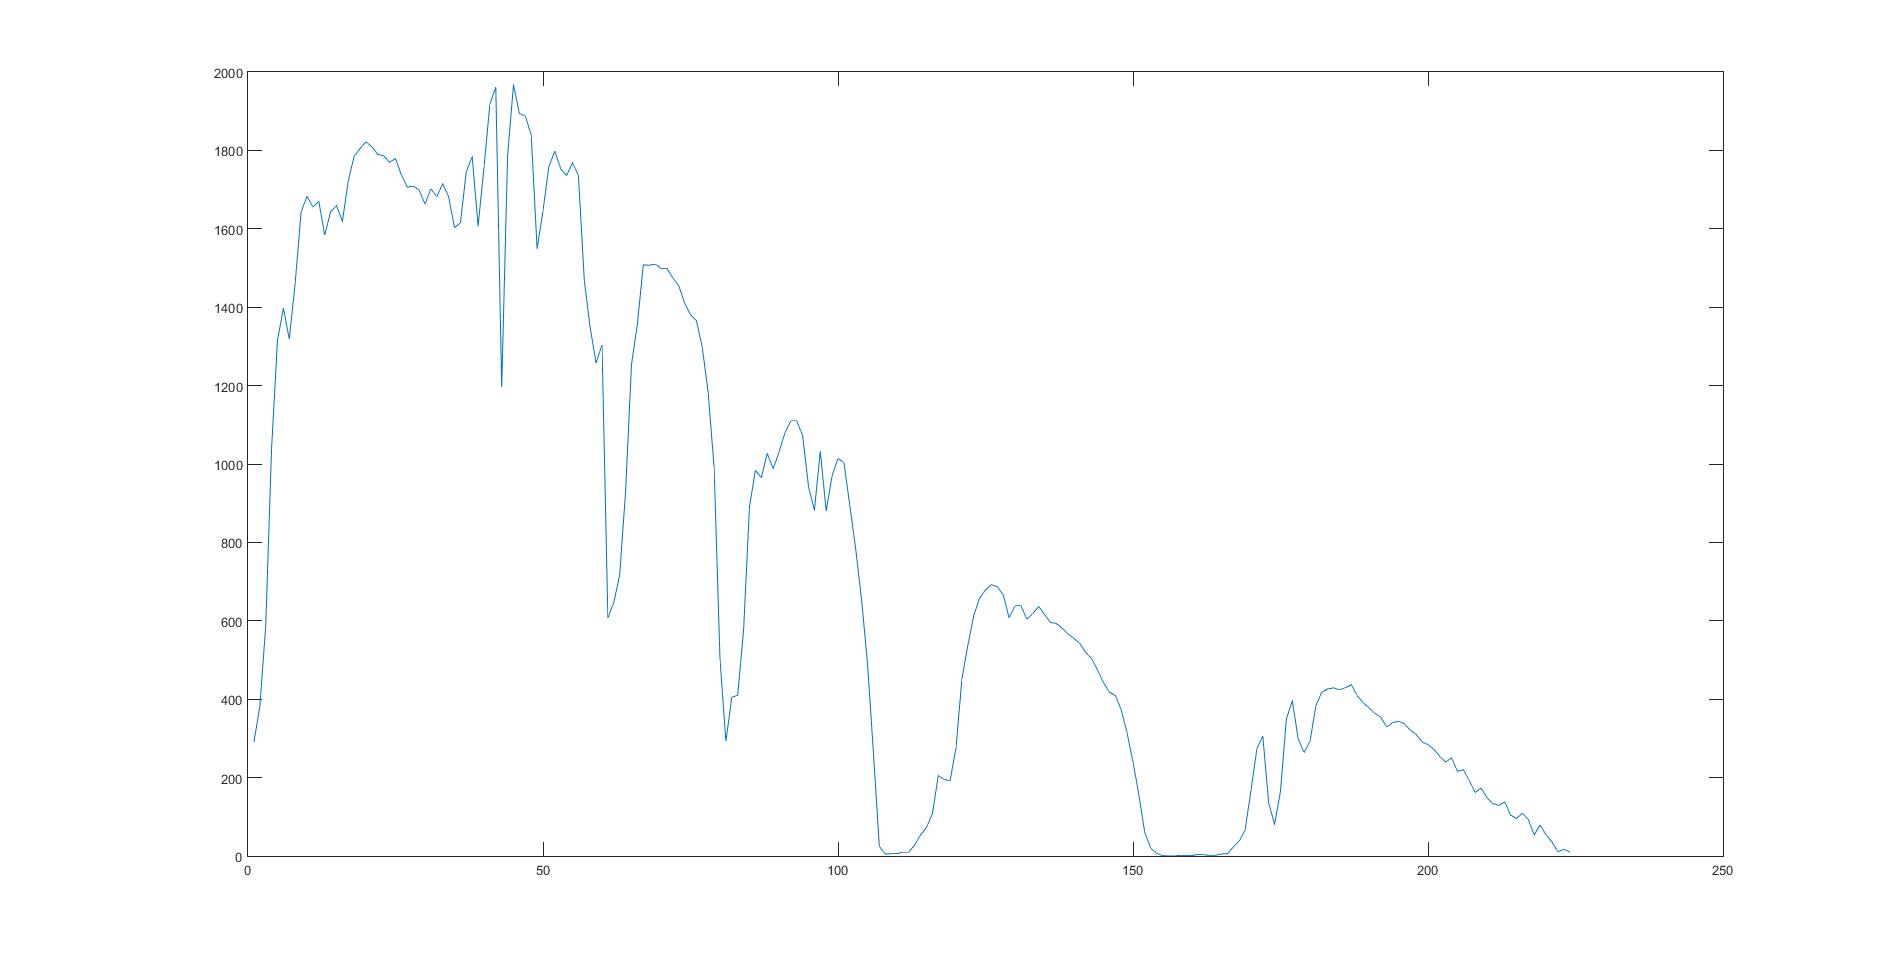
The figure above is the remote sensing image of a certain band and the spectral characteristic of a pixel.
2. Noise processing of hyperspectral data
Fine spectral data of hyperspectral images can fully reflect the subtle features of the ground feature spectrum. According to the relative differences in the spectral characteristics of different features, the feature classification can be realized, and target detection and fine classification can be realized.
However, due to the lack of light imaging energy due to the dense channel of the imaging spectrometer, it is more difficult to improve the signal-to-noise ratio (SNR) of hyperspectral images compared to panchromatic images . In the process of acquiring image data, the features of the ground features are prone to "distortion" under the influence of noise. In addition, due to the large amount of hyperspectral data, in the fine classification process, it is often necessary to perform dimensionality reduction processing, and in the process of dimensionality reduction, it is necessary to retain the signal and compression noise to the greatest extent, so accurate noise evaluation is necessary. In addition, noise has the most direct impact on the results of fine classification. Therefore, noise assessment is needed for hyperspectral data.
The main noise is considered to be Gaussian white noise, which is divided into additive noise and multiplicative noise.
There are three main methods for noise evaluation: laboratory method, dark current method and image method. Because the first two methods are difficult to implement in experiments, the third one, the image method , is widely used .
The image method is divided into the following types:
Uniform area method (HA)
The main idea is to select more than four uniform regions from the image and obtain the estimated value of image noise by calculating the average of the standard deviation of these uniform regions.
Disadvantages: Uniform region selection needs to be performed manually and cannot be automated; uniform regions that meet the conditions do not exist in most remote sensing maps; noise estimation of subregions cannot represent the noise of the entire image.
Geostatistical Method (GS)
The main idea: select several uniform narrow bands from the image, and realize the estimation of image noise by calculating the semi-variance function of these narrow bands. To a certain extent, the spatial correlation of imaging spectral data is used.
Disadvantage: Similar to the uniform area method.
Local Mean and Local Standard Deviation (LMLSD)
Main idea: Assume that the image is composed of a large number of uniform small blocks, and the noise is mainly additive noise. Using the concepts of local mean and local standard deviation, the image is divided into many small blocks, and then the standard deviation of these sub-blocks is calculated as the size of the local noise, and the average value of the local standard deviation containing the interval with the largest number of sub-blocks is selected as the entire image. Best noise estimate.
Disadvantages: Only valid for white Gaussian noise. For images with random Gaussian noise, the signal is disturbed by noise.
Spatial / spectral dimension decorrelation (SSDC)
The main idea: It is a noise assessment method specifically for hyperspectral images. It uses the characteristics of high correlation between the spatial and spectral dimensions of hyperspectral images, removes highly correlated signals through multivariate linear regression, and uses the resulting residual image pairs. Noise is estimated.
Evaluation: This method is less affected by the type of ground cover and can be automatically executed. It is a relatively stable method for evaluating hyperspectral image noise.
3. Common methods of dimensionality reduction of hyperspectral image data
The large number of spectral bands in hyperspectral remote sensing images provide extremely rich information for feature extraction, which is conducive to finer feature classification. However, the increase of bands will also lead to information redundancy and increased data processing complexity. .
Data dimensionality reduction meets the following conditions: retain the characteristic information of the data as much as possible; remove data redundancy and correlation.
Dimension reduction is mainly performed from two aspects of feature selection and feature extraction .
3.1 Feature selection
The feature selection is spectral combination, that is, m bands (n > m) are selected from the band with N original spectral band number, and the possible spectral combination number is
NM(N>M)
N/M(N-M)

NM(N>M)
N/M(N-M)
Here you can use the Band Index method to reduce the spectral band selection.
Band index method:
* hyperspectral remote sensing images are divided into k groups (such as shortwave light, visible light, near infrared) according to the correlation, and the number of bands in each group is set as. Using PIJ to represent the correlation coefficient between band I and band J, (σ I) to represent the variance of band II, RA to represent the sum of absolute values of correlation coefficient between band I and other bands in different groups, and RW to represent the mean of absolute values of correlation coefficient between band I and other bands in the same group, then

So the Band Index of the band can be expressed as:

The Band Index is an important parameter that reflects the overall inclusion of feature information and correlations in the band.
By combining Band Index , and the target object effective spectral range (effiective Spectral scope of Object) , we can choose the band, and further identify the next classification.
3.2 Feature Extraction
Is an image characteristic dimension reduction Hyperspectral extraction for the purpose of using low-dimensional data efficiently expressed high dimensional feature data, but also the amount of data compression, and more conducive to the rapid extraction of information. Dimensionality reduction comprises very extensive content, hyperspectral imagery mainly reduce spectral dimension and extract spectral feature dimensions based.
On a selected feature on the feature selection method mentioned feature selection spaces form a subspace of the original in the original feature space, the following describes the linear transformation method : from a high-dimensional data space, to produce a suitable low-dimensional subspace (not a simple combination of feature selection), so that the data can be described in the original data distribution to some optimal sense in this space.Y= BX
3.2.1 Principal Component Analysis
Principal component analysis (PCA) is the most basic method of dimensionality reduction hyperspectral data, hyperspectral data compression, decorrelation, noise removal and feature extraction plays a significant role. PCA transform, also known as Hotelling transform (hotelling transform) and KL (karhunen-loeve) transformation . Each of the principal components not related to each other after the conversion, with the main component and the amount of information contained in the reduced number of components.
In PCA transformation of hyperspectral remote sensing data, each band is generally treated as a vector. If hyperspectral remote sensing data has p bands and image spatial dimension is m × n, the specific processing flow is as follows:
- Image vectorization: input image data can be expressed as X= (x_1,x_2..... x_p)^T. Where Xi is a n × 1 column vector, where n = m × n. That is to say, the image is expanded by row or column and connected by rules, which is called a vector.
- Quantity centralization: subtract all vectors in the vector group from the mean vector of the vector group, i.e Y= X-E(x)
- Calculate the covariance matrix Σ of vector group y.
- Find eigenvalue matrix λ and exigent vector matrix A of covariance matrix Σ.
- Principal component transformation is carried out, z = A^T Y.
PCA transform is a kind of orthogonal linear transform based on information quantity. The transformed image information is mainly concentrated in the first several principal component components. The component components with small information quantity are discarded in the transform domain, and the approximate image of the restored image can still be obtained after the inverse transform.
Based on PCA transformation, block PCA, DPCA and selective PCA are proposed.
However, PCA transformation has two obvious defects: one is that the influence of image numerical transformation is obvious; the other is that the signal-to-noise ratio after transformation does not necessarily decrease with the increase of principal component number. For these two problems, standardized PCA (SPCA) and residual scaled PCA (RPCA) are developed.
3.2.2 maximum noise fraction transformation
When the variance of noise or the distribution of noise in each band of the image is not uniform, the PCA method based on the maximization of variance can not guarantee that the image quality will decrease with the increase of the principal component. So here we introduce the maximum noise fraction (MNF) transform, which arranges the components according to the image quality. MNF mainly uses SNR and noise ratio to describe image quality parameters.
0 comments:
Post a Comment