hyperspectral remote sensing and its geological applications
- 1. HYPERSPECTRAL REMOTE SENSING& itsGEOLOGICAL APPLICATIONS<br />1<br />
- 2. <ul><li>Hyperspectral sensors, or imaging spectrometers, are instruments that acquire images in many, very narrow, contiguous spectral bands throughout the visible, near-IR, mid-IR, and thermal IR portions of the spectrum.
- 3. These systems typically collect 200 or more bands of data, which enables the construction of an effectively continuous reflectance or emittance spectrum for every pixel in the scene.
- 4. These systems can discriminate among earth surface features that have diagnostic absorption and reflection characteristics over narrow wavelength intervals that are “lost” within the relatively coarse bandwidths of conventional multispectral scanners.</li></ul>2<br />What is Hyperspectral Remote Sensing???<br />
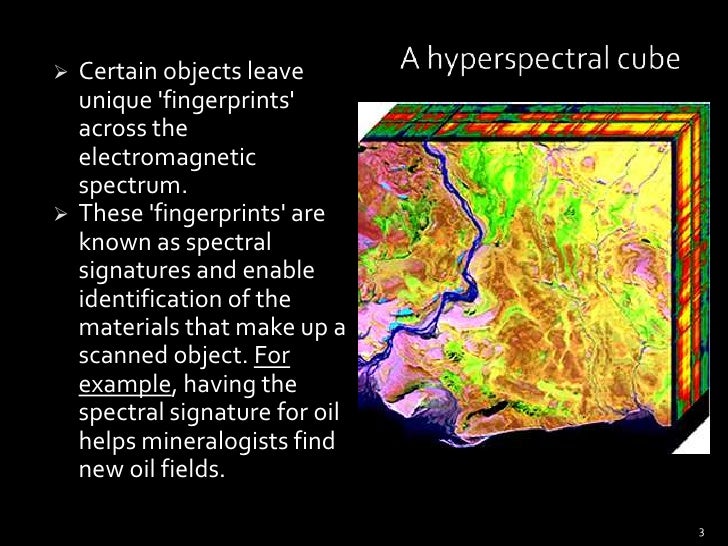
- 5. A hyperspectral cube<br /><ul><li>Certain objects leave unique 'fingerprints' across the electromagnetic spectrum.
- 6. These 'fingerprints' are known as spectral signatures and enable identification of the materials that make up a scanned object. For example, having the spectral signature for oil helps mineralogists find new oil fields.</li></ul>3<br />
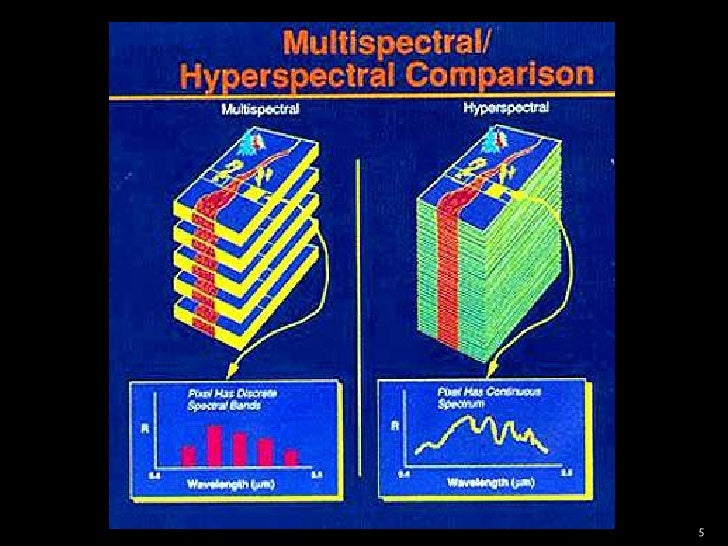
- 7. Hyperspectral versus multispectral remote sensing<br /><ul><li>Hyperspectral Imaging is related to multispectral imaging. The distinction between hyperspectral and multispectral is usually defined as the number of spectral bands.
- 8. Multispectral data contains from tens to hundreds of bands. Hyperspectral data contains hundreds to thousands of bands.
- 9. However, hyperspectral imaging may be best defined by the manner in which the data is collected. Hyperspectral data is a set of contiguous bands (usually by one sensor). Multispectral is a set of optimally chosen spectral bands that are typically not contiguous and can be collected from multiple sensors.</li></ul>4<br />
- 10. 5<br />
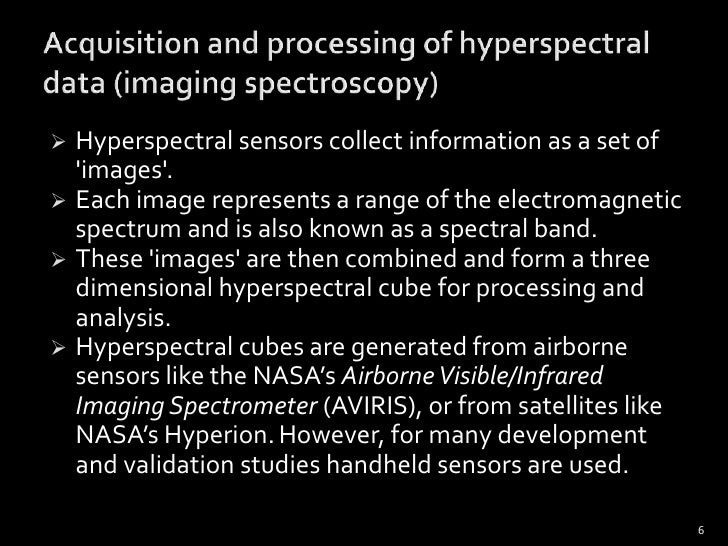
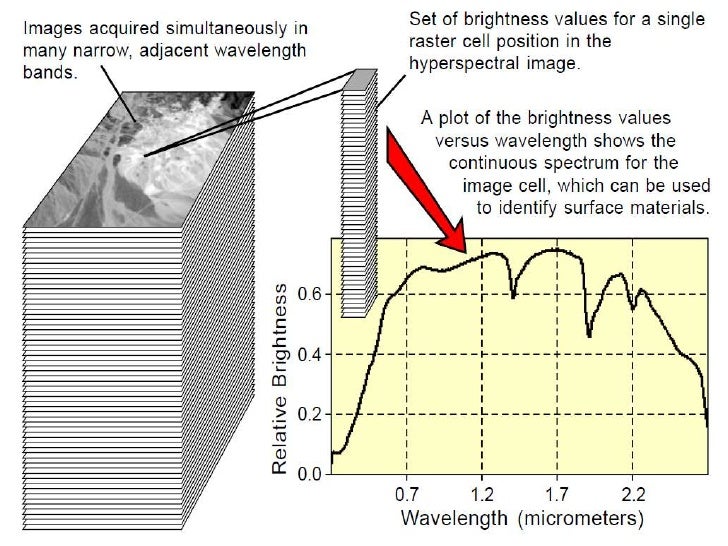
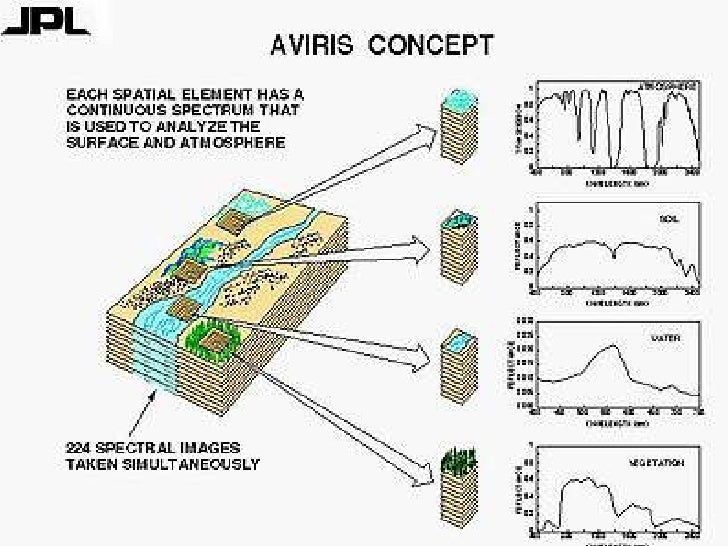
- 11. Acquisition and processing of hyperspectral data (imaging spectroscopy)<br /><ul><li>Hyperspectral sensors collect information as a set of 'images'.
- 12. Each image represents a range of the electromagnetic spectrum and is also known as a spectral band.
- 13. These 'images' are then combined and form a three dimensional hyperspectral cube for processing and analysis.
- 14. Hyperspectral cubes are generated from airborne sensors like the NASA’s Airborne Visible/Infrared Imaging Spectrometer (AVIRIS), or from satellites like NASA’s Hyperion.However, for many development and validation studies handheld sensors are used.</li></ul>6<br />
- 15. 7<br />
- 16. continued<br /><ul><li>The precision of these sensors is typically measured in spectral resolution, which is the width of each band of the spectrum that is captured.
- 17. If the scanner picks up on a large number of fairly narrow frequency bands, it is possible to identify objects even if said objects are only captured in a handful of pixels.
- 18. However, spatial resolution is a factor in addition to spectral resolution. If the pixels are too large, then multiple objects are captured in the same pixel and become difficult to identify.
- 19. If the pixels are too small, then the energy captured by each sensor-cell is low, and the decreased signal-to-noise ratio reduces the reliability of measured features.
- 20. MicroMSI, Opticks and Envi are three remote sensing applications that support the processing and analysis of hyperspectral data.</li></ul>8<br />
- 21. Imaging Spectrometers<br /><ul><li>An imaging spectrometer is an instrument used in the field of imaging spectroscopy to acquire a spectrally-resolved image of an object or scene, often referred to as a datacube due to the three-dimensional representation of the data. The principle of operation is the same as that of the simple spectrometer, but special care is taken to avoid optical aberrations for better image quality.
- 22. Example imaging spectrometer types include: filtered camera, whiskbroom scanner, pushbroom scanner, integral field spectrograph (or related dimensional reformatting techniques), wedge imaging spectrometer, Fourier transform imaging spectrometer, computed tomography imaging spectrometer (CTIS), image replicating imaging spectrometer (IRIS), and coded aperture imaging spectrometer.</li></ul>9<br />
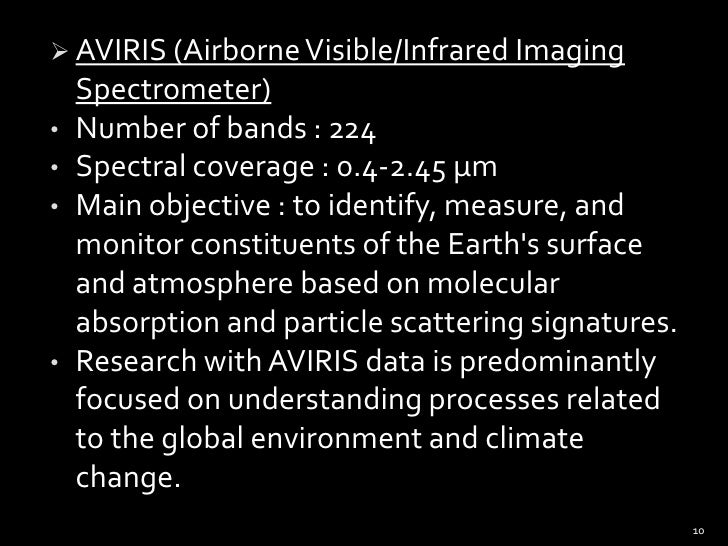
- 23. <ul><li>AVIRIS (Airborne Visible/Infrared Imaging Spectrometer)
- 24. Number of bands : 224
- 25. Spectral coverage : 0.4-2.45 µm
- 26. Main objective : to identify, measure, and monitor constituents of the Earth's surface and atmosphere based on molecular absorption and particle scattering signatures.
- 27. Research with AVIRIS data is predominantly focused on understanding processes related to the global environment and climate change.</li></ul>10<br />
- 28. 11<br />
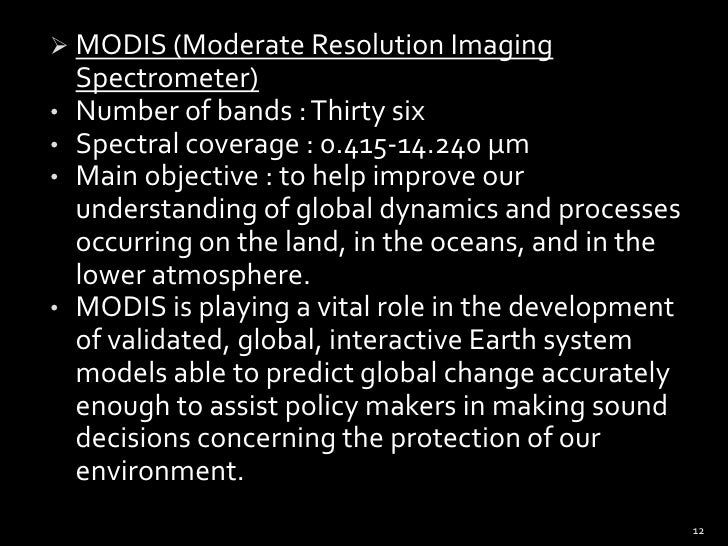
- 29. <ul><li>MODIS (Moderate Resolution Imaging Spectrometer)
- 30. Number of bands : Thirty six
- 31. Spectral coverage : 0.415-14.240 µm
- 32. Main objective : to help improve our understanding of global dynamics and processes occurring on the land, in the oceans, and in the lower atmosphere.
- 33. MODIS is playing a vital role in the development of validated, global, interactive Earth system models able to predict global change accurately enough to assist policy makers in making sound decisions concerning the protection of our environment.</li></ul>12<br />
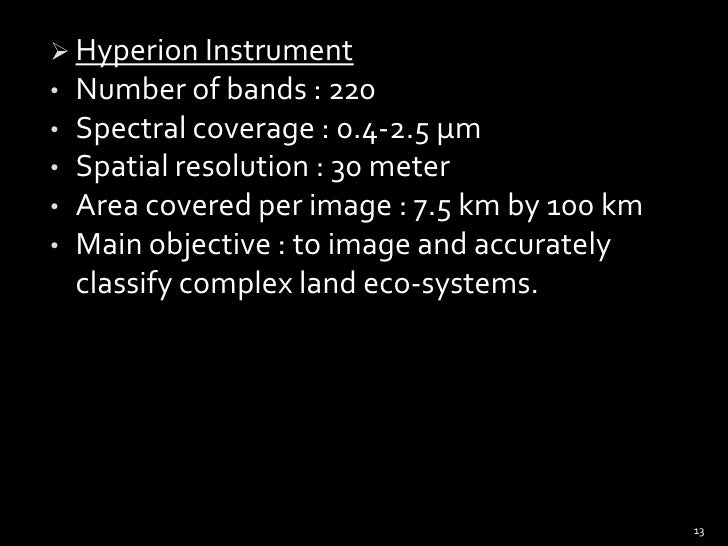
- 34. <ul><li>Hyperion Instrument
- 35. Number of bands : 220
- 36. Spectral coverage : 0.4-2.5 µm
- 37. Spatial resolution : 30 meter
- 38. Area covered per image : 7.5 km by 100 km
- 39. Main objective : to image and accurately classify complex land eco-systems.</li></ul>13<br />
- 40. THE HYPERION INSTRUMENT<br />14<br />
- 41. The Hyperion onboard NASA’S EO-1 satellite<br />15<br />
- 42. GEOLOGICAL APPLICATIONS<br />Mineral exploration<br /><ul><li>Although originally developed for mining and geology (the ability of hyperspectral imaging to identify various minerals makes it ideal for the mining and oil industries, where it can be used to look for ore and oil), it has now spread into fields as wide-spread as ecology and surveillance.
- 43. Organizations such as NASA and the USGS have catalogues of various minerals and their spectral signatures, and have posted them online to make them readily available for researchers.</li></ul>The ASTER spectral library<br /><ul><li> The Advanced Spaceborne Thermal Emission Reflection Radiometer (ASTER) on NASA’s Terra platform has been widely used in geological and other science studies.
- 44. In support of ASTER studies, a library of natural and man-made materials was compiled as the ASTER spectral library.
- 45. The ASTER spectral library currently contains nearly 2000 spectra, including minerals, rocks, soils, man-made materials, water, and</li></ul> snow. Many of the spectra cover the entire wavelength region from 0.4 to 14 micro meters.<br />16<br />
- 46. 17<br />
- 47. The ASTER spectral library plot for Quartz<br />Name: Quartz SiO2 Type: Mineral Class: Silicates Subclass: Tectosilicates (Silica Group) Particle Size: Coarse (75 - 250 Micrometers) Sample No.: quartz.1 Owner: JHU Wavelength Range: IR Origin: Brazil, via Bruce Hemingway, USGS Description: The hand sample appeared entirely pure, being a clear and transparent fragment of a single crystal. This purity was confirmed under the microscope and by XRD analysis, as well as within the limits of microprobe error. Measurement: Bidirectional reflectance <br />18<br />
- 48. 19<br />
- 49. 20<br />
- 50. Comparison of AVIRIS and Hyperion for HyperspectralMineral Mapping<br /><ul><li>This was a case study by Fred A. Kruse in order to determine the functional accuracy of the Hyperion instrument, as compared to the AVIRIS.
- 51. This study was carried out for the hyperspectral mineral mapping of Cuprite in Nevada in the USA.</li></ul>21<br />
- 52. <ul><li>This study compares mineral mapping results from AVIRIS data acquired 19 June 1997 to Hyperion data collected 1 March 2001. The figure shows reference images for the AVIRIS (left) and Hyperion data (right) respectively.
- 53. The site is typically described as consisting of two hydrothermal centers. These can be seen in the images as bright areas to the right and left of the road running from NW to SE across the scenes.</li></ul>22<br />
- 54. RESULTS:<br />Operationally, spectral bands covering the short wave infrared (SWIR) spectral range 2.0 – 2.5 μm for AVIRIS and 2.0 – 2.4 μmfor Hyperion were selected.<br />The results indicate that the AVIRIS data contain significantly more information than the Hyperion data covering approximately the same spatial area and spectral range.<br />CONCLUSION:<br />Analysis of Hyperion data for Cuprite, Nevada, which has established ground truth and years of airborne hyperspectraldata, show that Hyperion is performing to specifications and data from the short wave infrared (SWIR) spectrometer can be used to produce useful geologic (mineralogic) information.<br />AVIRIS data collected during June 1997 served as the “ground truth” for this investigation.<br />Comparison of Hyperion results to the known mineralogy derived from AVIRIS data generally validate on-orbit mineral mapping and Hyperion performance.<br />Minerals mapped at Cuprite using Hyperion include kaolinite, alunite, buddingtonite, calcite, muscovite, and hydrothermal silica.<br />23<br />
- 55. AVIRIS images of Cuprite deposits of Nevada<br />24<br />
- 56. 2. Searching for oil seeps and oil-impacted soil using Hyperspectral Imagery<br /><ul><li>For quite some time, specialists have considered using remote sensing technology to detect oil seeping out from subsurface petroleum reservoirs.
- 57. Until recently, these efforts have been hampered by the fact that the spatial and spectral resolution of most sensors is too limiting for use in onshore applications, especially in remote terrain.
- 58. A group of geologists came together and re-visited areas known to contain oil seeps and oil-impacted soils using hand-held hyperspectral sensors.
- 59. The primary mission of this ongoing project was to document spectral characteristics that are typically associated with oil-impacted soils and seeps.
- 60. These findings were then used to construct a spectral library that will make detection of onshore oil seeps and oil-impacted soil more rapid and reliable than traditional methods.</li></ul>25<br />
- 61. 3. MULTISPECTRAL AND HYPERSPECTRAL REMOTE SENSING OF ALPINE SNOW PROPERTIES<br />Models of processes in the alpine snow cover fundamentally depend on the spatial distribution of the surface energy balance over areas where topographic variability causes huge differences in the incoming solar radiation and in snow depth because of redistribution by wind.<br />The aim here, is to know which areas are covered by snow and snow’s spectral albedo, along with other factors such as grain size, contaminants, temperature, liquid water content, and depth or water equivalent.<br />From multispectral and hyperspectral remote sensing at wavelengths from 0.4–15 µm, the retrievable properties include snow-covered area, albedo, grain size, liquid water very near the surface, and temperature.<br />Spectral mixture analysis allows the retrieval of the subpixel variability of snow-covered area, along with the snow’s albedo.<br />26<br />
- 62. continued<br />Remaining research challenges include:<br /><ul><li>the remote sensing of absorbing impurities,
- 63. accounting for variability in the bidirectional-reflectance distribution function and the variability of grain size with depth,
- 64. retrieving snow cover in forested regions,
- 65. reconciling field measurements of emissivity with snow properties,
- 66. and adapting the algorithms to frequent, large-scale processing.
- 67. Earliest studies using multispectral sensing systems included the acquisition of such data in the visible and near IR regions of the electromagnetic spectrum.
- 68. Modern day hyperspectral instruments include AVIRIS, MODIS and Hyperion.</li></ul>27<br />
- 69. The need for snow mapping at sub-pixel resolution:<br />Snow-covered area in Alpine terrain often varies at a spatial scale finer than that of the ground IFOV of the remote sensing instrument.<br />This spatial heterogeneity poses a mixed pixel problem in that the sensor may measure radiance reflected from snow, rock, soil, and vegetation.<br />To use the snow characteristics in distributed physical models, we must therefore map snow-covered area at subpixelresolution in order to accurately represent its spatial distribution; otherwise, systematic errors may result.<br />28<br />
- 70. Three phases of water image with water vapor, liquid water, and ice displayed as a false-color image mixing blue, green, and red colors, respectively.<br />Melting snow and ice zones are shown by the color yellow where liquid water and ice are present together.<br />The red colors show areas where the snow is dry and there is little water vapor above the high-altitude surface.<br />Areas largely blue or green are snow-free; any water is either in the atmosphere (vapor) or vegetation (liquid).<br />29<br />
- 71. Miscellaneous Applications<br /><ul><li>In the fields of agriculture, vegetation, and forest,
- 72. urban planning,
- 73. surveillance.</li></ul>30<br />
- 74. References<br /><ul><li>Lillesand, M. Thomas; Kiefer, W. Ralph and Chipman, W. Jonathan; (2004); Remote Sensing and Image Interpretation; 5th ed.; Pp. xiv+1-763
- 75. Kruse, A. Fred; Comparison of AVIRIS and Hyperion for Hyperspectral Mineral Mapping
- 76. Baldridge, A.M.; Hook, S.J.; Grove, C.I.; Rivera G.; The Aster Spectral Library Version 2.0
- 77. Van der Meer, Freek (1994). Calibration of Airborne Visible/Infrared Imaging Spectrometer Data (AVIRIS) to Reflectance and Mineral Mapping in Hydrothermal Alteration Zones: An Example from the Cuprite Mining District.. Geocarto International, 3, 23-37.
- 78. Dozier, Jeff; Painter, H. Thomas; (2004); Multispectral and Hyperspectral Sensing of Alpine Snow Properties; Annual Review of Earth and Planetary Science, v. 32; Pp. 1-601</li></ul>31<br />
- 79. 32<br />http://www.gisdevelopment.net/aars/acrs/2000/ps1/ps112.asp<br />http://rst.gsfc.nasa.gov/Intro/Part2_24.html<br />http://en.wikipedia.org/wiki/Hyperspectral_imaging<br />http://web.archive.org/web/20071116214324/www.eomonline.com/archives.php<br />http://web.archive.org/web/20070221003645/www.eomonline.com/Common/Archives/2001jan/01jan_ellis.html<br />http://www.google.co.in/search?hl=en&source=hp&q=hymap%20hyperspectral&gbv=2&ie=UTF-8&sa=N&tab=iw<br />http://www.google.co.in/search?hl=en&q=mineral+mapping+using+hyperspectral+remote+sensing&btnG=Search&meta=&aq=f&oq=<br />http://www.google.co.in/search?hl=en&q=spectral+signatures+of+minerals&btnG=Search&meta=&aq=f&oq=<br />http://images.google.co.in/imgres?imgurl=http://www.fas.org/irp/imint/docs/rst/Intro/originals/FIG_48.JPG&imgrefurl=http://www.fas.org/irp/imint/docs/rst/Intro/Part2_24.html&usg=__LVlkkgLR-rQNubm48tIGIHjrURI=&h=302&w=400&sz=59&hl=en&start=16&um=1&tbnid=JBxYW6mi4nY2kM:&tbnh=94&tbnw=124&prev=/images%3Fq%3Dspectral%2Bsignature%2Bremote%2Bsensing%26hl%3Den%26sa%3DN%26um%3D1<br />http://www.sciencedirect.com/science?_ob=ArticleURL&_udi=B6T6X-4S7HWK6-1&_user=10&_rdoc=1&_fmt=&_orig=search&_sort=d&_docanchor=&view=c&_searchStrId=1093320510&_rerunOrigin=google&_acct=C000050221&_version=1&_urlVersion=0&_userid=10&md5=0ca020a09872829a46995ccb5113dea6<br />http://images.google.co.in/images?q=hyperspectral+satellite+imagery&btnG=Search+images&gbv=2&hl=en&sa=2&start=0<br />http://www.google.co.in/search?hl=en&source=hp&q=DEFINITION+OF+HYPERSPECTRAL+REMOTE+SENSING+&btnG=Google+Search&meta=&aq=o&oq=<br />http://scholar.google.co.in/scholar?q=DEFINITION+OF+HYPERSPECTRAL+REMOTE+SENSING&hl=en&um=1&ie=UTF-8&oi=scholart<br />http://search.nasa.gov/search/search.jsp?nasaInclude=hyperspectral+remote+sensing<br />http://en.wikipedia.org/wiki/Imaging_spectrometer<br />http://www.geo.unizh.ch/~schaep/research/apex/is_list.html<br />http://aviris.jpl.nasa.gov/html/data.html<br />http://speclib.jpl.nasa.gov/<br />http://speclib.jpl.nasa.gov/search-1/mineral<br />http://speclib.jpl.nasa.gov/search-1<br />http://modis.gsfc.nasa.gov/about/<br />http://eo1.gsfc.nasa.gov/Technology/Hyperion.html<br />
- 80. Presented byBanerjeeAbhijeet A.Roll No. 02M.Sc. (Previous)<br />33<br />
0 comments:
Post a Comment